Q-band Line Survey Observations Toward A Carbon-chain-rich Clump In The Serpens South Region
We have conducted Q-band (30 GHz − 50 GHz) line survey observations toward a carbon-chain emission peak in the Serpens South cluster-forming region with the extended Q-band (eQ) receiver installed on the Nobeyama 45 m radio telescope.
Approximately 180 lines have been detected including tentative detection, and these lines are attributed to 52 molecules including isotopologues. It has been found that this position is rich in carbon-chain species as much as Cyanopolyyne Peak in Taurus Molecular Cloud-1 (TMC-1 CP), suggesting chemical youth.
Not only carbon-chain species, but several complex organic molecules (CH3OH, CH3CHO, HCCCHO, CH3CN, and tentatively C2H3CN) have also been detected, which is similar to the chemical complexity found in evolved prestellar cores.
The HDCS/H2CS ratio has been derived to be 11.3±0.5 %, and this value is similar to the prestellar core L1544. The chemically young features that are similar to the less-dense starless core TMC-1 CP (104 cm−3 − 105 cm−3) and chemically evolved characters which resemble the dense prestellar core L1544 (∼106 cm−3) mean that the clump including the observed position is a pre-cluster clump without any current star formation activity.
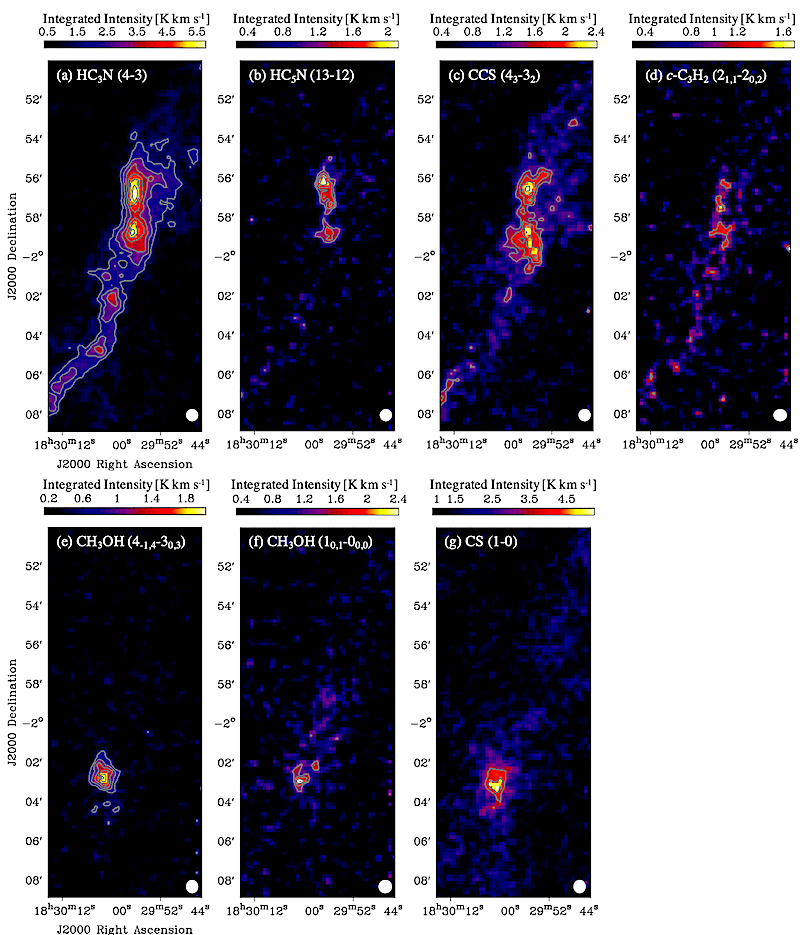
Integrated-intensity maps of (a) HC3N (4 − 3), (b) HC5N (13 − 12), (c) CCS (43 − 32), (d) c-C3H2 (21,1 − 20,2), (e) CH3OH (4−1,4 − 30,3 E), (f) CH3OH (10,1 − 00,0 A), and (g) CS (1 − 0). Noise levels of each panel are (a) 0.4 K km s−1 , (b) 0.27 K km s−1 , (c) 0.33 K km s−1 , (d) 0.29 K km s−1 , (e) 0.15 K km s−1 , (f) 0.34 K km s−1 , and (g) 0.89 K km s−1 , respectively. The contour levels are 4,6,8,10,12,13σ for panels (a) and (e), 4,5,6,7σ for panels (b), (c), and (f), and 4,5σ for panels (d) and (g). The white-filled circle at the bottom right shows a typical beam size of the Q-band (37′′). Alt text: Seven two-dimensional maps in the right ascension-declination coordinate. The unit is Kelvin kilometer per second. — astro-ph.GA
Kotomi Taniguchi, Fumitaka Nakamura, Sheng-Yuan Liu, Tomomi Shimoikura, Chau-Ching Chiong, Kazuhito Dobashi, Naomi Hirano, Yoshinori Yonekura, Hideko Nomura, Atsushi Nishimura, Hideo Ogawa, Chen Chien, Chin-Ting Ho, Yuh-Jing Hwang, You-Ting Yeh, Shih-Ping Lai, Yasunori Fujii, Yasumasa Yamasaki, Quang Nguyen-Luong, Ryohei Kawabe
Comments: Accepted for publication in Publications of the Astronomical Society of Japan (PASJ), 32 pages, 9 figures, 6 tables
Subjects: Astrophysics of Galaxies (astro-ph.GA); Solar and Stellar Astrophysics (astro-ph.SR)
Cite as: arXiv:2409.16492 [astro-ph.GA] (or arXiv:2409.16492v1 [astro-ph.GA] for this version)
https://doi.org/10.48550/arXiv.2409.16492
Focus to learn more
Submission history
From: Kotomi Taniguchi Dr.
[v1] Tue, 24 Sep 2024 22:36:02 UTC (23,911 KB)
https://arxiv.org/abs/2409.16492
Astrobiology, Astrochemistry,