Venus As An Exoplanet Analog: Extended UV Transit Signatures And Coronal Occultations
Stellar activity manifests differently across wavelengths, causing flux variability that can obscure planetary transits. While transit observations are typically performed in the visible and infrared bands, where stellar flux is relatively stable, short-wavelength regimes exhibit high variability, complicating reliable detections.
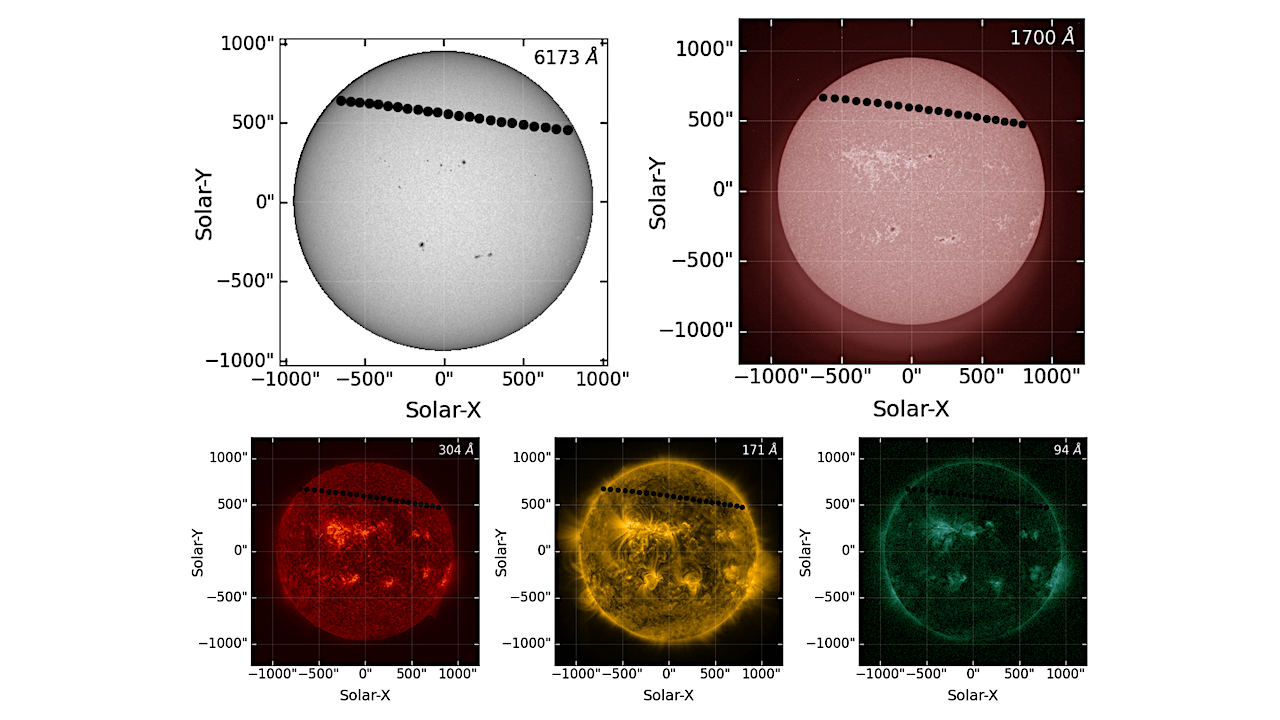
Here, we analyze the 2012 transit of Venus as an exoplanet analog using multiwavelength observations taken by the Solar Dynamics Observatory (SDO) in five channels: 6173~Å (continuum), 1700~Å (broadband), and three extreme-UV (EUV) narrowbands at 304~Å, 171~Å, and 94~Å. We find that the disk-integrated transit signal is clearly detectable in the 6173~Å band, whereas strong solar activity-induced fluctuations obscure the transit in the EUV channels.
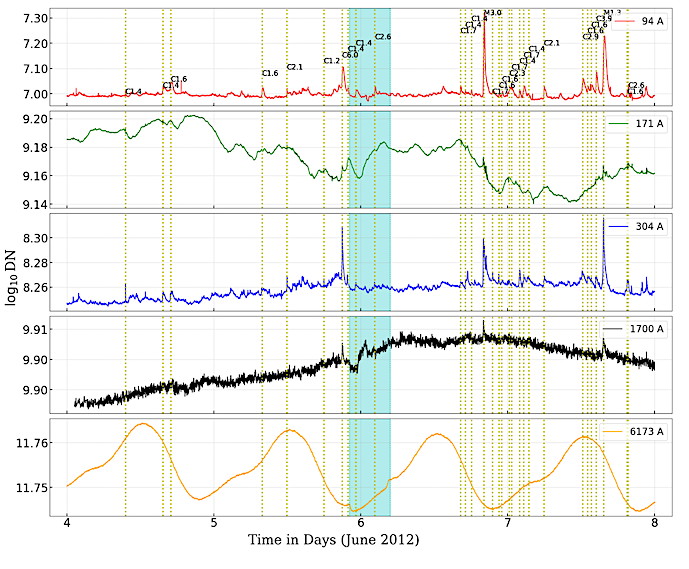
Disk-integrated light curves in five wavelengths bands from SDO’s time series images taken between 4-7 June, 2012. A vertical cyan box marks the Venus transit, starting at 22:10 UTC on 5 June and ending at 04:50 UTC on 6 June 2012. The yellow dotted lines indicate the time when solar flares occurred during this 96 hours observation window. The strength of each flare is labeled to the right of the respective dotted lines in the top panel. Panels from top-to-bottom corresponds to 94 Å, 171 Å, 304 Å, 1700 Å, 6173 Å channel, respectively. — astro-ph.EP
Notably, the 1700~Å UV transit is noisier but significantly longer (≈9.2~hrs) than the visible-band transit (≈6.7~hrs), because Venus began occulting the extended coronal features before ingress onto the visible disk. This observation highlights the potential of UV transits to probe the spatial extent of stellar coronae in exoplanetary systems.
Numerical simulations further suggest that limb-brightened stars in quiescence phase may exhibit distinctive UV/EUV transit signatures, opening new possibilities for exoplanet detection and characterization in these spectral regimes.
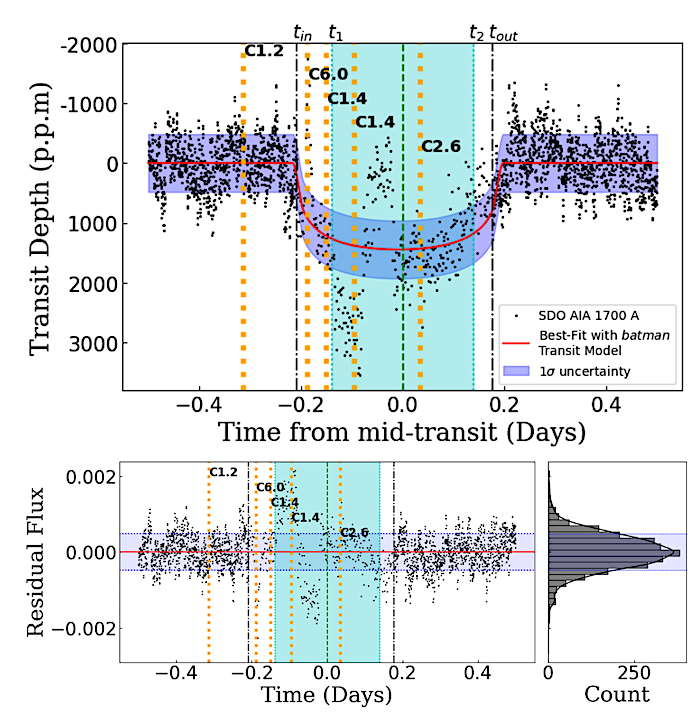
Transit light curve in the 1700 Å band (top). The red curve shows the best-fit model with the blue shaded region denoting the 1σ = 4.8×10⁻⁴ uncertainty. Black dash-dotted lines mark Venus’s entry tin and exit tout from AIA’s FoV while the cyan-shaded region between t1 and t2 indicates the transit in white light. The green dashed line marks the mid-transit time. Bottom panel: residuals of the 1700 Å light curve with 1σ bounds shown in blue. Yellow dashed lines indicate flare timings and relative strengths. — astro-ph.EP
Tisyagupta Pyne, Belur Ravindra, Ravinder K. Banyal
Comments: 14 pages. 11 figures, Accepted for publication in MNARS
Subjects: Earth and Planetary Astrophysics (astro-ph.EP)
Cite as: arXiv:2512.06509 [astro-ph.EP] (or arXiv:2512.06509v1 [astro-ph.EP] for this version)
https://doi.org/10.48550/arXiv.2512.06509
Focus to learn more
Submission history
From: Ravinder Banyal
[v1] Sat, 6 Dec 2025 17:39:42 UTC (6,979 KB)
https://arxiv.org/abs/2512.06509
Astrobiology,