An Unusual Dust Storm Reveals How Mars Lost Some Of Its Water
The current image of Mars as an arid and hostile desert contrasts with the history revealed by its surface. Channels, minerals altered by water, and other geological traces indicate that the Red Planet was once a much wetter and more dynamic world.
Reconstructing how this water-rich environment disappeared remains one of the great challenges of planetary science. Although several processes can explain part of this loss, the fate of much of martian water is still unknown.
Postdoctoral physicist Adrián Brines, in collaboration with researchers Shohei Aoki and Frank Daerden, explain how they and a team from multiple institutions worldwide have demonstrated that an anomalous, intense, but localised dust storm was able to drive the transport of water to the upper layers of the martian atmosphere during summer in the northern hemisphere.
This finding reveals the impact of this type of storm on the planet’s climate evolution and opens a new path for understanding how Mars lost much of its water over time.
Hydrogen escape on the Red Planet
One of the keys to understanding how much water Mars has lost is measuring how much hydrogen has escaped into space, since hydrogen is released when water molecules break down in the atmosphere. Current measurements indicate that Mars has lost an enormous amount of water over billions of years – enough to cover much of its surface to depths of hundreds of meters.
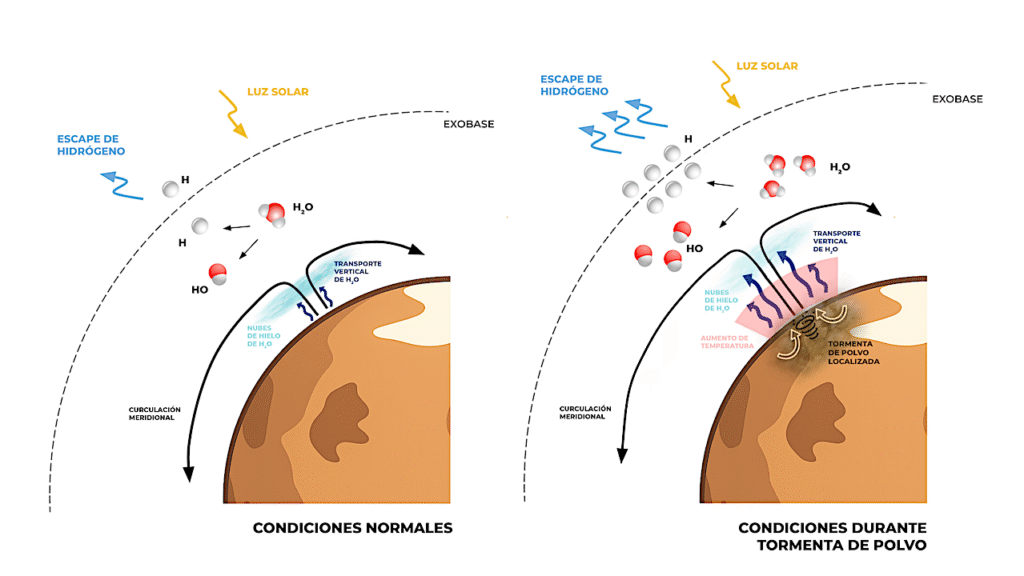
Diagram showing how a dust storm in the northern hemisphere during summer affects the atmosphere. Dust absorbs more sunlight, heating the air, especially at mid-altitudes. Stronger air circulation carries water vapor upwards, allowing more hydrogen to escape into space. Credits: Brines, Aoki et al.
Mars orbit is more elliptical than Earth’s, meaning that for part of the year the planet is closer to the Sun, receiving more energy. Hence, summers in the southern hemisphere are much warmer and more dynamic than those in the northern hemisphere. During this period, the atmosphere becomes dusty and heats up, allowing water vapor to rise to high altitudes, where solar radiation breaks it down and hydrogen can escape into space.
In contrast, during northern summer, water typically remains confined to lower altitudes, and atmospheric escape is much weaker. This seasonal cycle makes the southern-hemisphere summer the main period of water loss on Mars.
An unexpected episode
In our new study, we detected an unusual increase in water vapor in the middle atmosphere of Mars during northern-hemisphere summer in Martian Year 37 (2022–2023 on Earth) caused by an anomalous dust storm. No similar dust storm, in terms of location and season, has been observed on Mars in nearly two decades.
We analysed the event using combined data from several active Mars orbiters: ESA’s ExoMars Trace Gas Orbiter (TGO) and its NOMAD instrument, NASA’s Mars Reconnaissance Orbiter (MRO) and the Emirates Mars Mission (EMM).
These observations allowed us to study not only the vertical distribution of water vapor, but also the distribution of dust in the atmosphere, the formation of water ice clouds, and the escape of hydrogen into space.
We found that this dust storm triggered a sudden and intense injection of water vapor that reached heights of up to 60–80 kilometres, particularly at high northern latitudes. At these altitudes, the amount of water was up to ten times greater than usual—a phenomenon not observed in previous martian years and not predicted by current climate models.
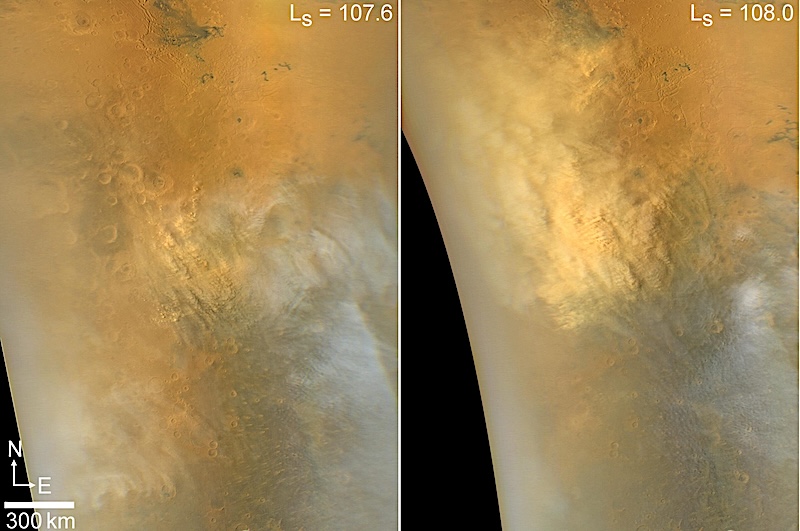
Images showing the early growth of a rare regional dust storm in northwestern Syrtis Major, covering up to 1.2 million km². Photos taken on 21-22 August 2023. Credits: Brines, Aoki et al. (larger image)
We detected this excess of water vapor simultaneously at all longitudes, indicating that the water spread rapidly around the planet. We found that after a few weeks, the amount of dust in the atmosphere returned to normal levels, and consequently, the water vapor once again was confined in the lower layers.
The phenomenon was not limited to the middle atmosphere. Independent observations from EMM and MRO showed a significant increase in hydrogen also in the uppermost layers of the atmosphere shortly afterwards. As a result, hydrogen escape increased by approximately a factor of 2.5 compared to previous years during the same season.
Although this episode was brief and not as intense as the major hydrogen-loss events associated with the austral summer and global dust storms, it demonstrates that Mars can lose water significantly even during traditionally quiet periods.
These results add a new piece to the incomplete picture of how Mars has been losing its water over billions of years and show that short but intense episodes can play a relevant role in the climate evolution of the Red Planet.
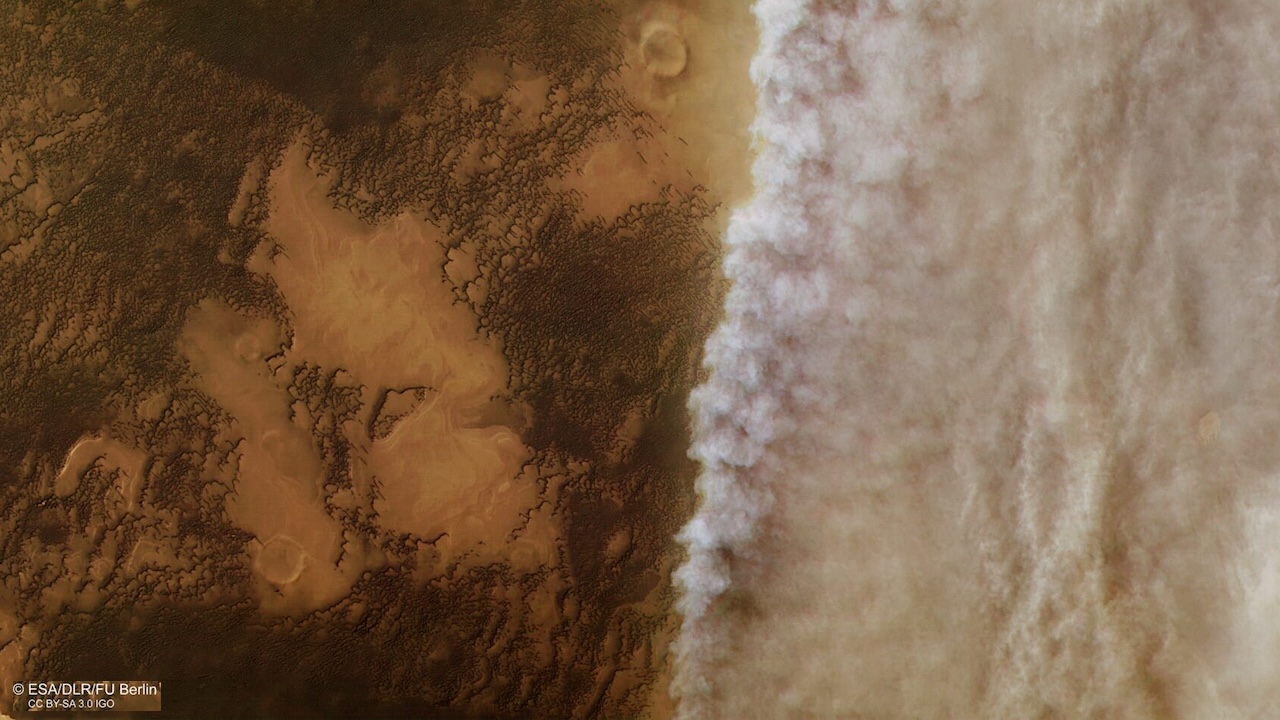
ESA’s ExoMars Trace Gas Orbiter captured this dust devil tracking across the martian surface on 3 December 2021. Credits: ESA/TGO/CaSSIS
The paper “Out-of-season water escape during Mars’ northern summer triggered by a strong localized dust storm” was published by Communications Earth & Environment on 2 February 2026. (open access)
The research is a collaboration between multiple institutions, led by researchers from the Instituto de Astrofísica de Andalucía (IAA-CSIC) in Spain, the University of Tokyo in Japan, and the Royal Belgian Institute for Space Aeronomy (BISA) in Brussels.
Astrobiology, Astrogeology,

