NotPlaNET: Removing False Positives from Planet Hunters TESS with Machine Learning
Differentiating between real transit events and false positive signals in photometric time series data is a bottleneck in the identification of transiting exoplanets, particularly long-period planets.
This differentiation typically requires visual inspection of a large number of transit-like signals to rule out instrumental and astrophysical false positives that mimic planetary transit signals. We build a one-dimensional convolutional neural network (CNN) to separate eclipsing binaries and other false positives from potential planet candidates, reducing the number of light curves that require human vetting.
Our CNN is trained using the TESS light curves that were identified by Planet Hunters citizen scientists as likely containing a transit. We also include the background flux and centroid information. The light curves are visually inspected and labeled by project scientists and are minimally pre-processed, with only normalization and data augmentation taking place before training.
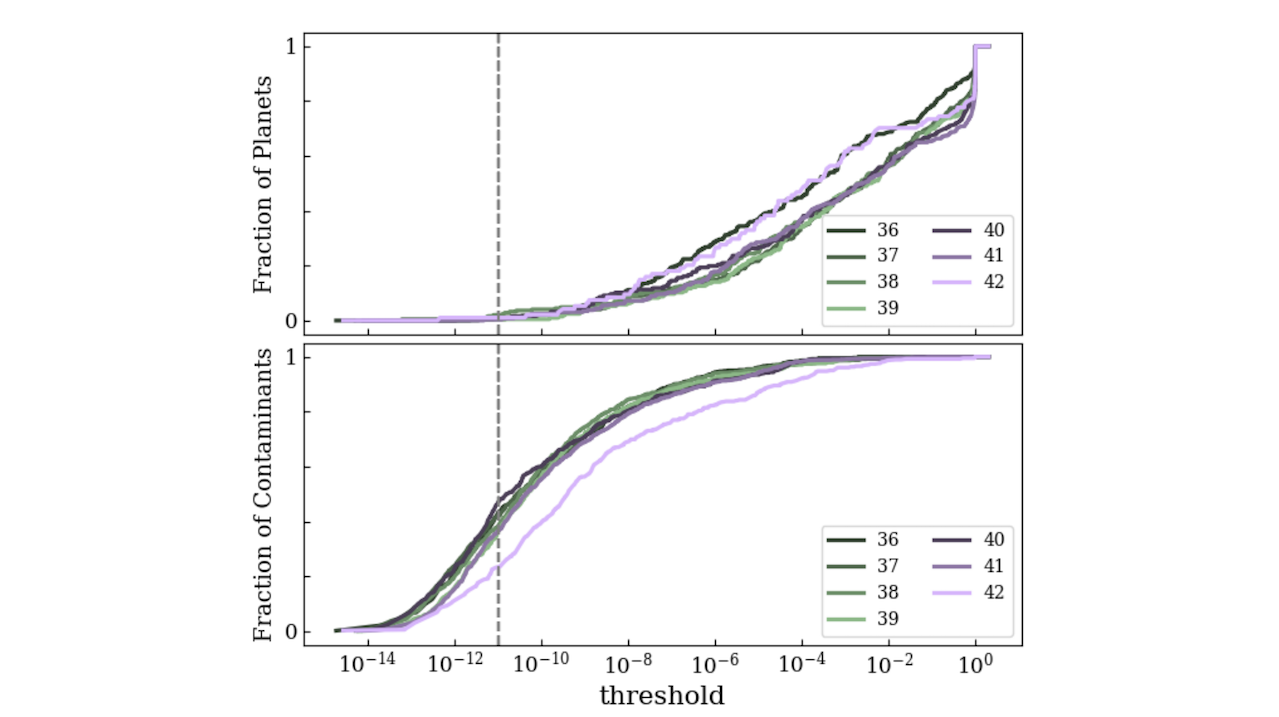
The median percentage of contaminants flagged across the test sectors is 18% with a maximum of 37% and a minimum of 10%. Our model keeps 100% of the planets for 16 of the 18 test sectors, while incorrectly flagging one planet candidate (0.3%) for one sector and two (0.6%) for the remaining sector. Our method shows potential to reduce the number of light curves requiring manual vetting by up to a third with minimal misclassification of planet candidates.
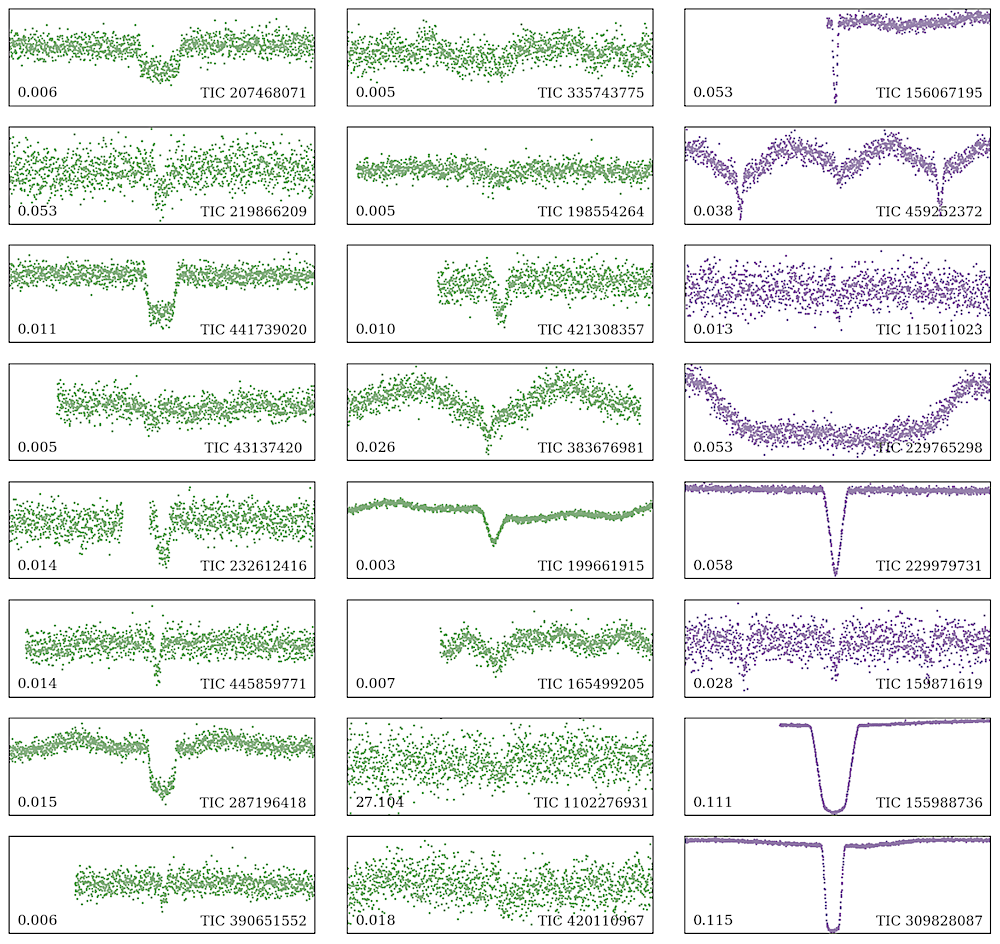
Selected light curve chunks from sector 50. The rightmost column (purple) contains the light curves flagged as contaminants by our model. The leftmost and middle columns (green) contain light curves classified as ‘keep for further vetting.’ The left column shows true planet candidates, while the middle one shows true contaminants that were incorrectly classified as ‘keep for further vetting.’ The y-axis range is displayed in the lower-left corner of each panel, while the lower-right corner displays the TIC ID of the light curve. — astro-ph.EP
Valentina Tardugno Poleo (NYU), Nora Eisner (CCA), David W. Hogg (NYU, CCA)
Comments: Under review at The Astronomical Journal
Subjects: Earth and Planetary Astrophysics (astro-ph.EP); Instrumentation and Methods for Astrophysics (astro-ph.IM); Machine Learning (cs.LG)
Cite as: arXiv:2405.18278 [astro-ph.EP] (or arXiv:2405.18278v1 [astro-ph.EP] for this version)
https://doi.org/10.48550/arXiv.2405.18278
Focus to learn more
Submission history
From: Valentina Tardugno Poleo
[v1] Tue, 28 May 2024 15:29:40 UTC (1,154 KB)
https://arxiv.org/abs/2405.18278
Astrobiology