Constructing the Molecular Tree of Life using Assembly Theory and Mass Spectrometry
The connected nature of all life on earth, dating back to the last universal common ancestor (LUCA), has been explored using knowledge of taxonomy and biochemistry, with significant insights enabled by molecular sequence data. However, in many cases reliable sequence data is not available or scarce.
A molecular approach that goes beyond sequence information could allow investigating the molecular evolution of, and the relationship between, living systems in a more universal way. Here we demonstrate the first biochemistry-agnostic approach to map evolutionary relationships at the molecular scale, allowing the construction of phylogenetic models using mass spectrometry (MS) and Assembly Theory (AT) without elucidating molecular identities.
AT allows us to estimate the complexity of molecules by deducing the amount of shared information stored within them when . By examining 74 samples from a diverse range of biotic and abiotic sources, we used tandem MS data to detect 24,102 analytes (9262 unique) and 59,518 molecular fragments (6,755 unique). Using this MS dataset, together with AT, we were able to infer the joint assembly spaces (JAS) of samples from molecular analytes.
We show how JAS allows agnostic annotation of samples without fingerprinting exact analyte identities, facilitating accurate determination of their biogenicity and taxonomical grouping. Furthermore, we developed an AT-based framework to construct a biochemistry agnostic phylogenetic tree which is consistent with genome-based models and outperforms other similarity-based algorithms. Finally, we were able to use AT to track colony lineages of a single bacterial species based on phenotypic variation in their molecular composition with high accuracy, which would be challenging to track with genomic data.
Our results demonstrate how AT can expand causal molecular inference to non-sequence information without requiring exact molecular identities, thereby opening the possibility to study previously inaccessible biological domains.

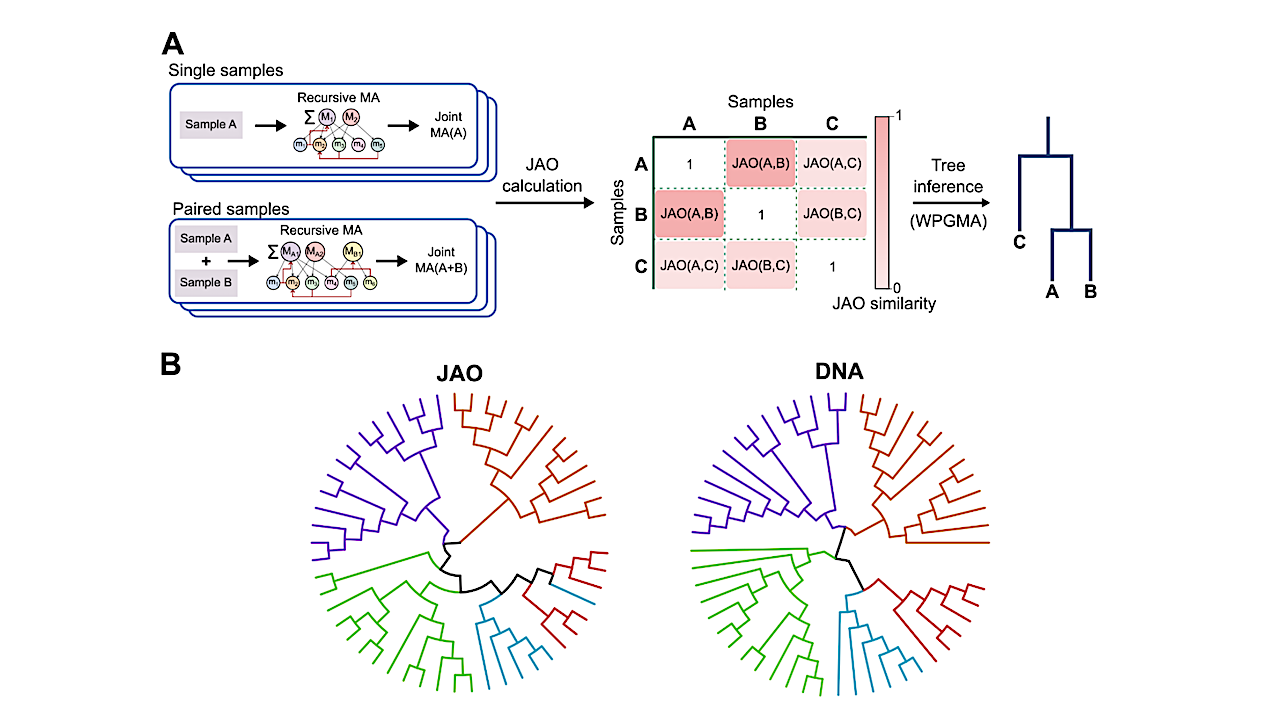
Assembly-based phylogenetic Tree of Life from non-targeted metabolite information. A) The JAO tree with species annotation. The position of samples within this tree is not pre-determined by a priori cladistic knowledge, such as through genomic, proteomic or metabolic information. Colours refer to cladal domains. Lengths of the branches correspond to 2 minus JAO of the clustered clades. B) Kernel Density Estimate (KDE) plots of the m/z values of all shared MS2 fragments between samples of different geodesic distances in the JAO tree model. Arrows indicate the trends in the data. C) Histograms of randomly-generated phylogenetic trees models showing their Generalized Robinson-Foulds (GRF) similarity scores to the consensual genome-based tree model. The different distributions refer to higher degree of constraints in the randomity of the tree generation, depicted in the inset, where randomness was allowed within predefined cladal groups. Purple – completely random, blue – separating prokeryotes and eukaryotes, light blue – separating the bacterial, archaeal and eukaryotic domains, and green – separating the cladal domains of bacteria, archaea, plants, fungi and animals. Colored circles in the inset refer to the cladal groups as appeared in A. The vertical dashed lines represent the score of the assembly based tree models, which are 0.58 for the fingerprinting, 0.28 for ACO and 0.63 for JAO. Ttests of the JAO model against the random-trees distributions all results in essentially p-value = 0.0. — q-bio.PE
Amit Kahana, Alasdair MacLeod, Hessam Mehr, Abhishek Sharma, Emma Carrick, Michael Jirasek, Sara Walker, Leroy Cronin
Comments: 26 pages, 8 figures, 45 references
Subjects: Populations and Evolution (q-bio.PE)
Cite as: arXiv:2408.09305 [q-bio.PE] (or arXiv:2408.09305v1 [q-bio.PE] for this version)
https://doi.org/10.48550/arXiv.2408.09305
Submission history
From: Leroy Cronin Prof
[v1] Sat, 17 Aug 2024 22:39:34 UTC (1,708 KB)
https://arxiv.org/abs/2408.09305
Astrobiology, Astrochemistry,