New Maps Reveal Lake Rotorua’s Hidden Depths And Hydrothermal Systems
Following on from the Lake Rotomahana (2020), Lake Rotoiti (2021), and Lake Tarawera (2022) map releases, this new addition has redefined our understanding of the region’s hidden depths.
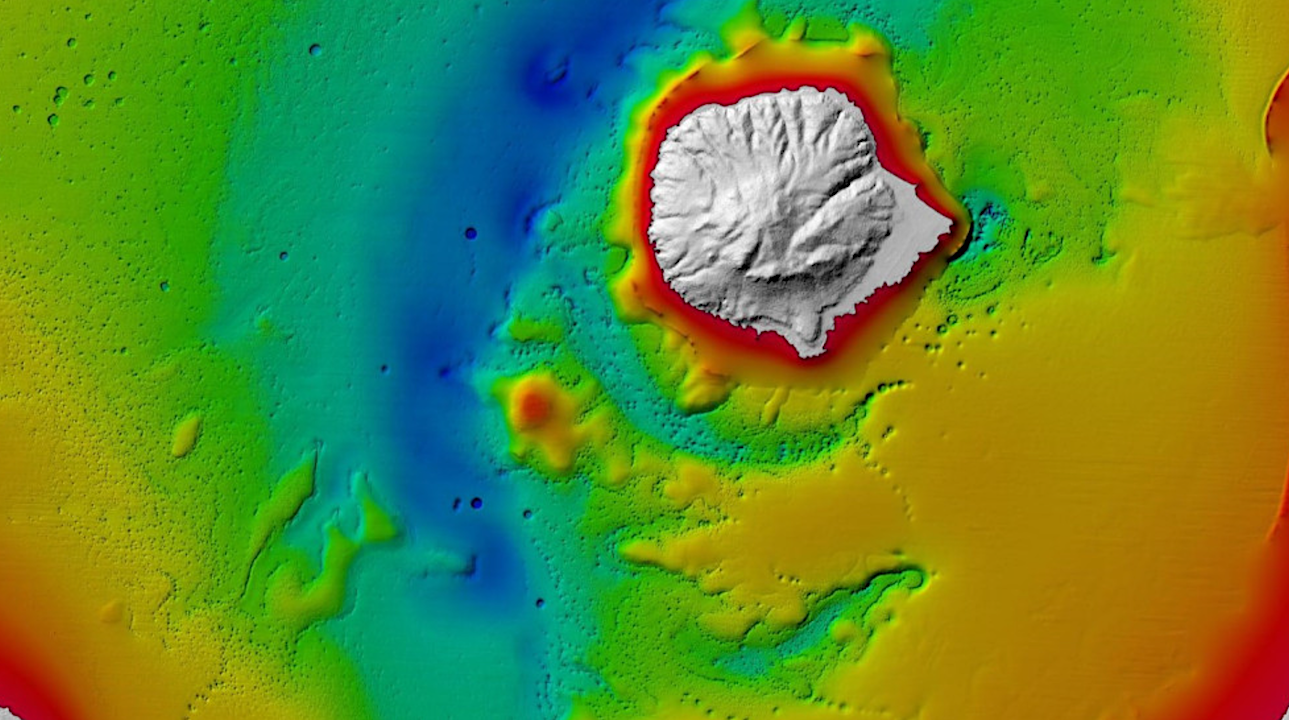
The Lake Rotorua Map (2023) captures the bathymetry of the lake floor in unprecedented detail. Mapping includes a 2-meter grid of bathymetric data, reaching a maximum depth of 53.5 meters off Sulphur Point.
The bathymetric map reveals thousands of pockmarks that dot the lake floor, with some reaching an impressive 50 meters in diameter. These pockmarks are characteristic of gas discharge, the small craters pointing to where the release of gas bubbles have disturbed sedimentation on the lake floor.
The bathymetric map also shows evidence for an ancient river that once meandered and carved the land offshore of Sulphur Point, winding its way to the west of Mokoia Island and curving to the northeast. The depiction of a river provides a tangible link to the landscape that predates the formation of Lake Rotorua, which is linked to when the Rotorua Caldera last subsided ~220,000 years ago. Geological evidence indicates Lake Rotorua is at least 65,000 years old and has been at its current level since 22,000 years ago.
Active hydrothermal system mapped for the first time
Close to the heart of Rotorua city, just offshore the iconic Sulphur Point, the map reveals an active underwater hydrothermal system characterised by numerous hydrothermal eruption craters. These craters, now venting hot water and gas, are clear evidence of the various inputs into the lake that affect its ecosystem. To better understand the geological setting of the lake and its sublacustrine hydrothermal system, GNS scientists have gone ‘below’ the surface of the lake by conducting gravity, magnetic and heat flow surveys.
Lead author Dr. Cornel de Ronde shares, “It’s a prime example of a holistic approach to understanding our geothermal-hosted volcanic lakes, empowering us to better model the intricate workings of the Rotorua geothermal system that projects offshore from Sulphur Point.”
The high heat flow offshore Sulphur Point is illustrated in the conductive heat flow map (left), where hot water is rising up to the lake floor as shown by the deep red-brown colours which are encircled by a donut-shaped zone coloured dark blue where cold lake water is being drawn down beneath the lake floor.
The same story is depicted in the magnetic intensity map (right). That is, volcanic rocks typically contain the mineral magnetite which is highly magnetic and aligns itself to the earth’s magnetic field. However, hot water can transform magnetite into a mineral called pyrite, which has virtually no magnetic signal. This is shown by the indigo colours covering the hydrothermal eruption craters which relate to very low, or no magnetic intensity. Combined, both the magnetic intensity and the conductive heat flow datasets provide good evidence that the area offshore Sulphur Point is an active hydrothermal system and has been for some time. Significantly, this system is believed to be an extension of the onshore Rotorua geothermal system and opens a new chapter in our understanding of the complex interplay between terrestrial and lacustrine parts of the same geothermal system.
Surveys reveal subsurface secrets
The magnetic survey also shows how volcanic rocks to the southwest and southeast of the lake project under the shoreline (red colours). Moreover, the data also show a subtle magnetic anomaly in the center of the lake (orange), northwest of Mokoia Island. This anomaly coincides with a subtle heat flow anomaly, hinting at a possible igneous intrusion and another hydrothermal system nearby—exciting clues as to the hydrothermal processes at play beneath the lake floor.
Looking deeper into the region’s geology, our experts gained intriguing insights from conducting a gravity survey. In contrast to the bathymetric data, which shows the details of the lakefloor, the free air gravity dataset showcases the varying depths of the basement greywacke rocks underlying the lake. The mapping shows the basement rocks are at their shallowest in the southwestern part of the lake and progressively deepen towards the northeast, adding to our understanding on the structure of the basement below Rotorua caldera.
We are excited not only for how these new maps broaden our collective knowledge of region, but also celebrate the iconic landscape and will contribute to further study in the future.
Paul Scholes, Senior Environmental Scientist from Bay of Plenty Regional Council Toi Moana says, “The new maps are fundamental in assisting Bay of Plenty Regional Council and the wider community in managing the lake and its associated geothermal resources. The geographical and geological information added provides invaluable information to the taonga that are the Te Arawa Rotorua lakes and the series of maps being developed provides a great resource for our community.”
The mapping project has been an exemplar in cross-government collaboration, Commander Tim Hall, the Royal New Zealand Navy’s chief Hydrographer, says “This activity provided our hydrographic surveyors a valuable opportunity to gain experience in a freshwater environment and demonstrates the ability of different government agencies to collaborate effectively for a common purpose.”
Additional imagery, maps, and data
Astrobiology