Curves Of Growth For Transiting Exocomets: Application To Fe II Lines In The Beta Pictoris System
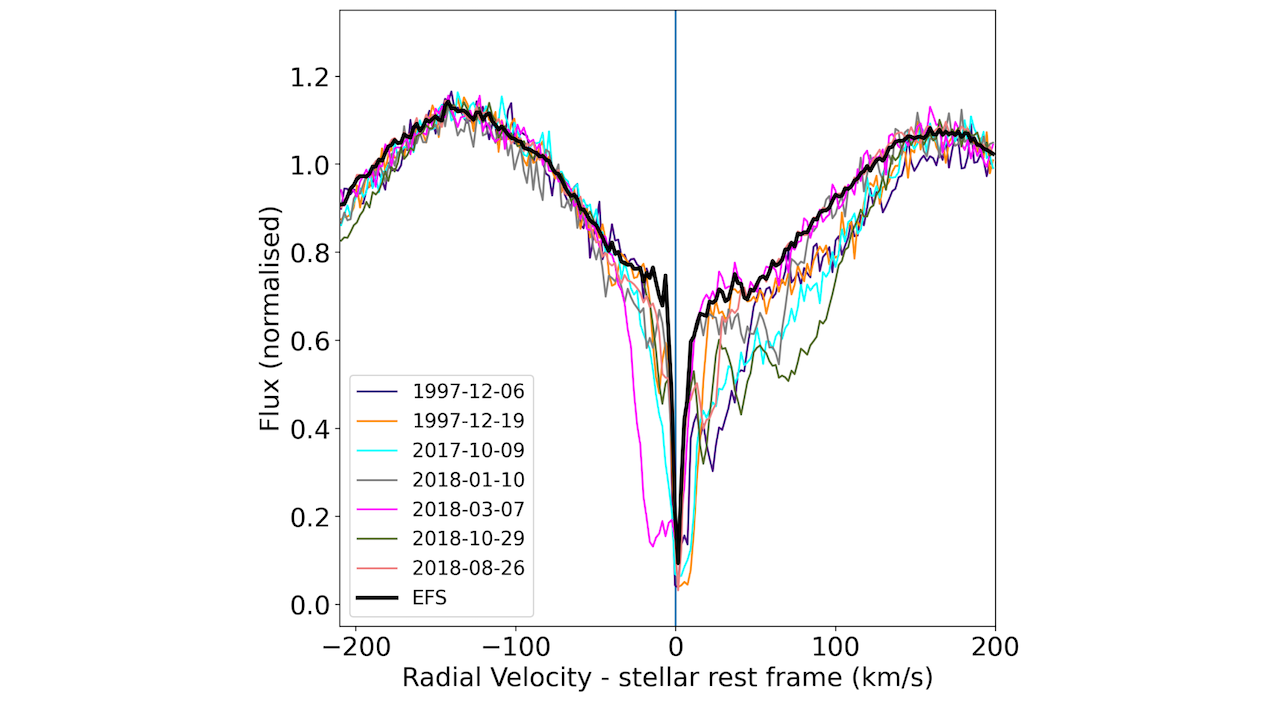
This study introduces the exocomet curve of growth, a new method to analyse the variable absorptions observed in β Pictoris spectrum and link them to the physical properties of the transiting cometary tails.
We show that the absorption depth of a comet in a set of lines arising from similar excitation levels of a given chemical species follows a simple curve as a function of the gf-values of the lines. This curve is the analogue of the curve of growth for interstellar absorption lines, where equivalent widths are replaced by absorption depths.
To fit this exocomet curve of growth, we introduce a model where the cometary absorption is produced by a homogeneous cloud, covering a limited fraction of the stellar disc. This model is defined by two parameters: α, the covering factor of the cloud, and β, related to its typical the optical depth.
This model is tested on two comets observed with the Hubble Space Telescope in December 1997 and October 2018, in a set of Fe II lines at 275 nm. The measured absorption depths are found to satisfactory match the two-parameter curve of growth model, indicating that both comets cover roughly 40 % of the stellar disc (α=0.4) and have optical thicknesses close to unity.
Then, we show that if we consider a set of lines arising from a wider range of energy levels, the absorbing species seems to be populated at thermodynamical equilibrium, causing the cometary absorption to follow a curve of growth as a function of gf⋅e−El/kBT (where T is the temperature of the absorbing medium).
For the comet observed on December 6, 1997, we derive a temperature of 10500±500 K and a total Fe II column density of (1.11±0.09)×1015 cm−2. By probing the population of the highest excited energy levels (El∼25000 cm−1), we also estimate an electronic density of (3±1)×107 cm−3.
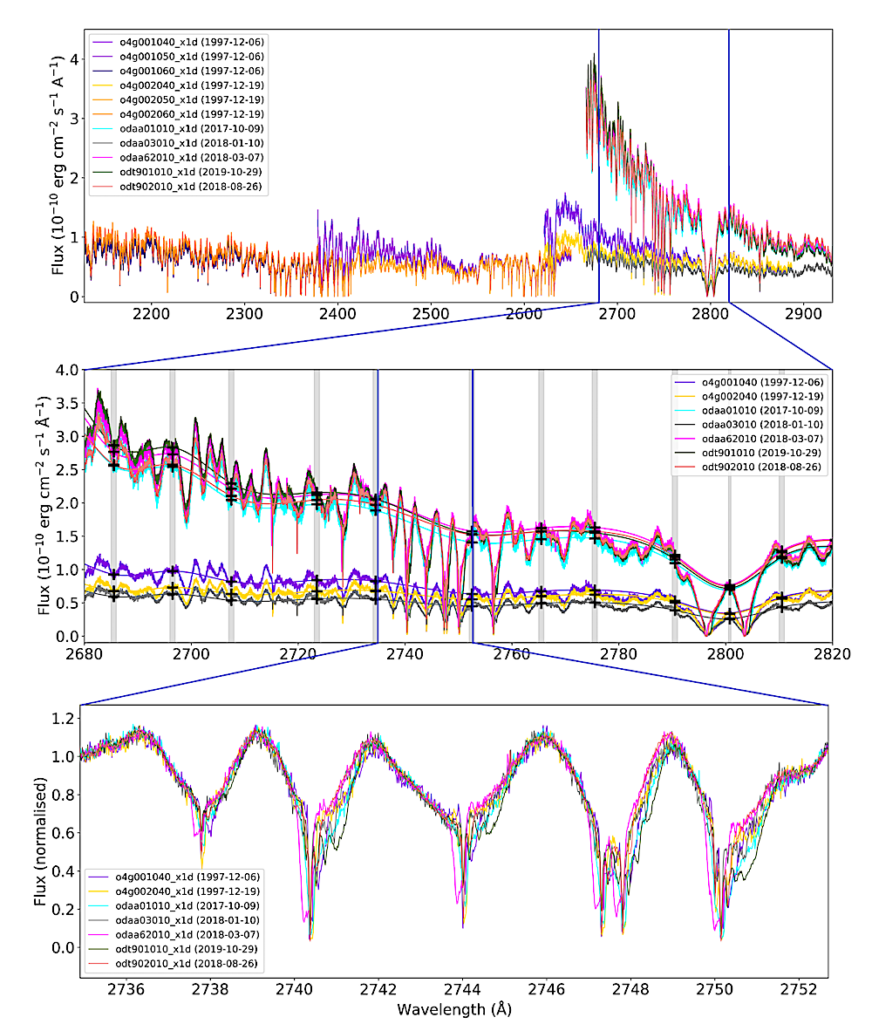
Illustration of the recalibration method. Top panel: Raw spectra show significant shape disparities, probably resulting from changes in instrument calibration throughout the years. These calibration disparities are hardly fitted by polynomials. Centre panel: Zoomed-in view of 2680-2820 Å region, showing the splines fitted to each spectrum. The grey areas indicate the different spectral domains where the reference fluxes were measured (black crosses), which are then used to calculate a cubic spline for each spectrum. Bottom panel: Zoomed-in view of 2735-2753 Å region after renormalisation by the cubic splines. The spectra taken at different epochs are shown with different colours; they are well superimposed in the region of the stellar continuum, while variable absorptions are clearly visible around the different Fe ii lines between 2737 and 2750 Å. — astro-ph.EP
T. Vrignaud, A. Lecavelier des Etangs, F. Kiefer, A.-M. Lagrange, G. Hébrard, P. A. Strøm, A. Vidal-Madjar
Comments: 19 pages, 16 figures
Subjects: Earth and Planetary Astrophysics (astro-ph.EP)
Cite as: arXiv:2402.10169 [astro-ph.EP] (or arXiv:2402.10169v1 [astro-ph.EP] for this version)
Submission history
From: Théo Vrignaud
[v1] Thu, 15 Feb 2024 18:14:33 UTC (13,538 KB)
https://arxiv.org/abs/2402.10169
Astrobiology,