The Distribution Of CO2 On Europa Indicates An Internal Source Of Carbon
Jupiter’s moon Europa has a subsurface ocean, the chemistry of which is largely unknown. Carbon dioxide (CO2) has previously been detected on the surface of Europa, but it was not possible to determine whether it originated from subsurface ocean chemistry, was delivered by impacts, or was produced on the surface by radiation processing of impact-delivered material.
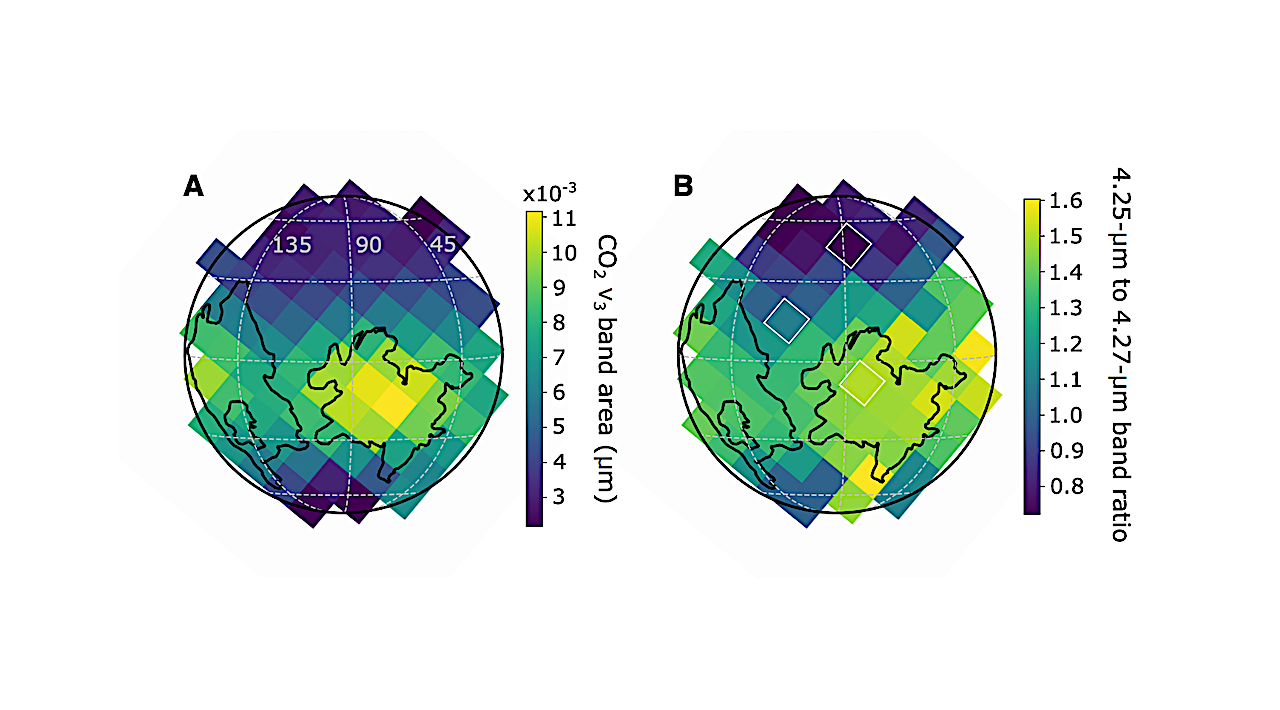
We map the distribution of CO2 on Europa using observations obtained with the James Webb Space Telescope (JWST) and find a concentration of CO2 within Tara Regio, a recently resurfaced terrain. This indicates the CO2 is derived from an internal carbon source. We propose the CO2 formed in the internal ocean, though we cannot rule out formation on the surface by radiolytic conversion of ocean-derived organics or carbonates.
Comparison between spectra of Europa and of other Solar System bodies. (A) Spectra (average of 4 spatial pixels) of Tara Regio (green) and a location north of Tara Regio (blue). Labels indicate the n3 band of CO2, the 3.5-µm band of hydrogen peroxide (H2O2), and the 3.1- µm reflectance peak of water ice. Also shown for comparison are a spectrum of Occator crater on Ceres (dotted black line), which has absorption due to carbonate minerals (37); a spectral ratio of the tiger stripes region relative to nearby regions on Enceladus (dashed black line) (36), which exhibits absorptions interpreted as organics; and a continuum-removed spectrum of the trailing hemisphere of Iapetus (dash-dotted black line), which shows bands at ~3.3 µm and ~3.45 µm due to aromatic and aliphatic organics, respectively (34). All spectra have been normalized at 3.6 µm and the Ceres, Enceladus, and Iapetus spectra are offset for display by 0.55, 0.5, and 0.78 units, respectively. (B) The ratio (solid black line) between the spectra of Tara Regio and the region to its north from panel A. The same spectra of Enceladus, Iapetus, and Ceres as in panel A are included for comparison, with additional bands labelled. We attribute the 3.5-µm band in the ratio spectrum to excess H2O2, which has previously been seen to be more abundant in Tara Regio (40). No other absorption bands are evident in the ratio spectrum, except for a ≲ 1% deviation from the continuum near 4.0 µm, which is too shallow to indicate abundant carbonates and immediately borders the gap in JWST spectral coverage. (C) Optical imaging mosaic of Europa projected to the JWST observing geometry. Overlain are the boundaries of the chaos terrain (black outlines (11)) and the locations of the NIRSpec pixels we used to produce the average spectra of Tara Regio (green squares) and the terrain to its north (blue squares) in panel A. Dashed white lines mark the 45°W, 90°W, and 135°W meridians and the 60°S, 30°S, 0°N, 30°N, and 60°N parallels. The background Europa image is the USGS Voyager – Galileo global mosaic (51). — astro-ph.EP
Samantha K. Trumbo, Michael E. Brown
Comments: This is the author’s version of the work. It is posted here by permission of the AAAS for personal use, not for redistribution. The definitive version was published in Science on September 21, 2023, DOI: this https URL
Subjects: Earth and Planetary Astrophysics (astro-ph.EP)
Cite as: arXiv:2309.11684 [astro-ph.EP] (or arXiv:2309.11684v1 [astro-ph.EP] for this version)
https://doi.org/10.48550/arXiv.2309.11684
Focus to learn more
Related DOI:
https://doi.org/10.1126/science.adg4155
Focus to learn more
Submission history
From: Samantha Trumbo
[v1] Wed, 20 Sep 2023 23:33:51 UTC (1,738 KB)
https://arxiv.org/abs/2309.11684
Astrobiology