Variability Due To Climate And Chemistry In Observations Of Oxygenated Earth-analogue Exoplanets
The Great Oxidation Event was a period during which Earth’s atmospheric oxygen (O2) concentrations increased from ∼10−5 times its present atmospheric level (PAL) to near modern levels, marking the start of the Proterozoic geological eon 2.4 billion years ago.
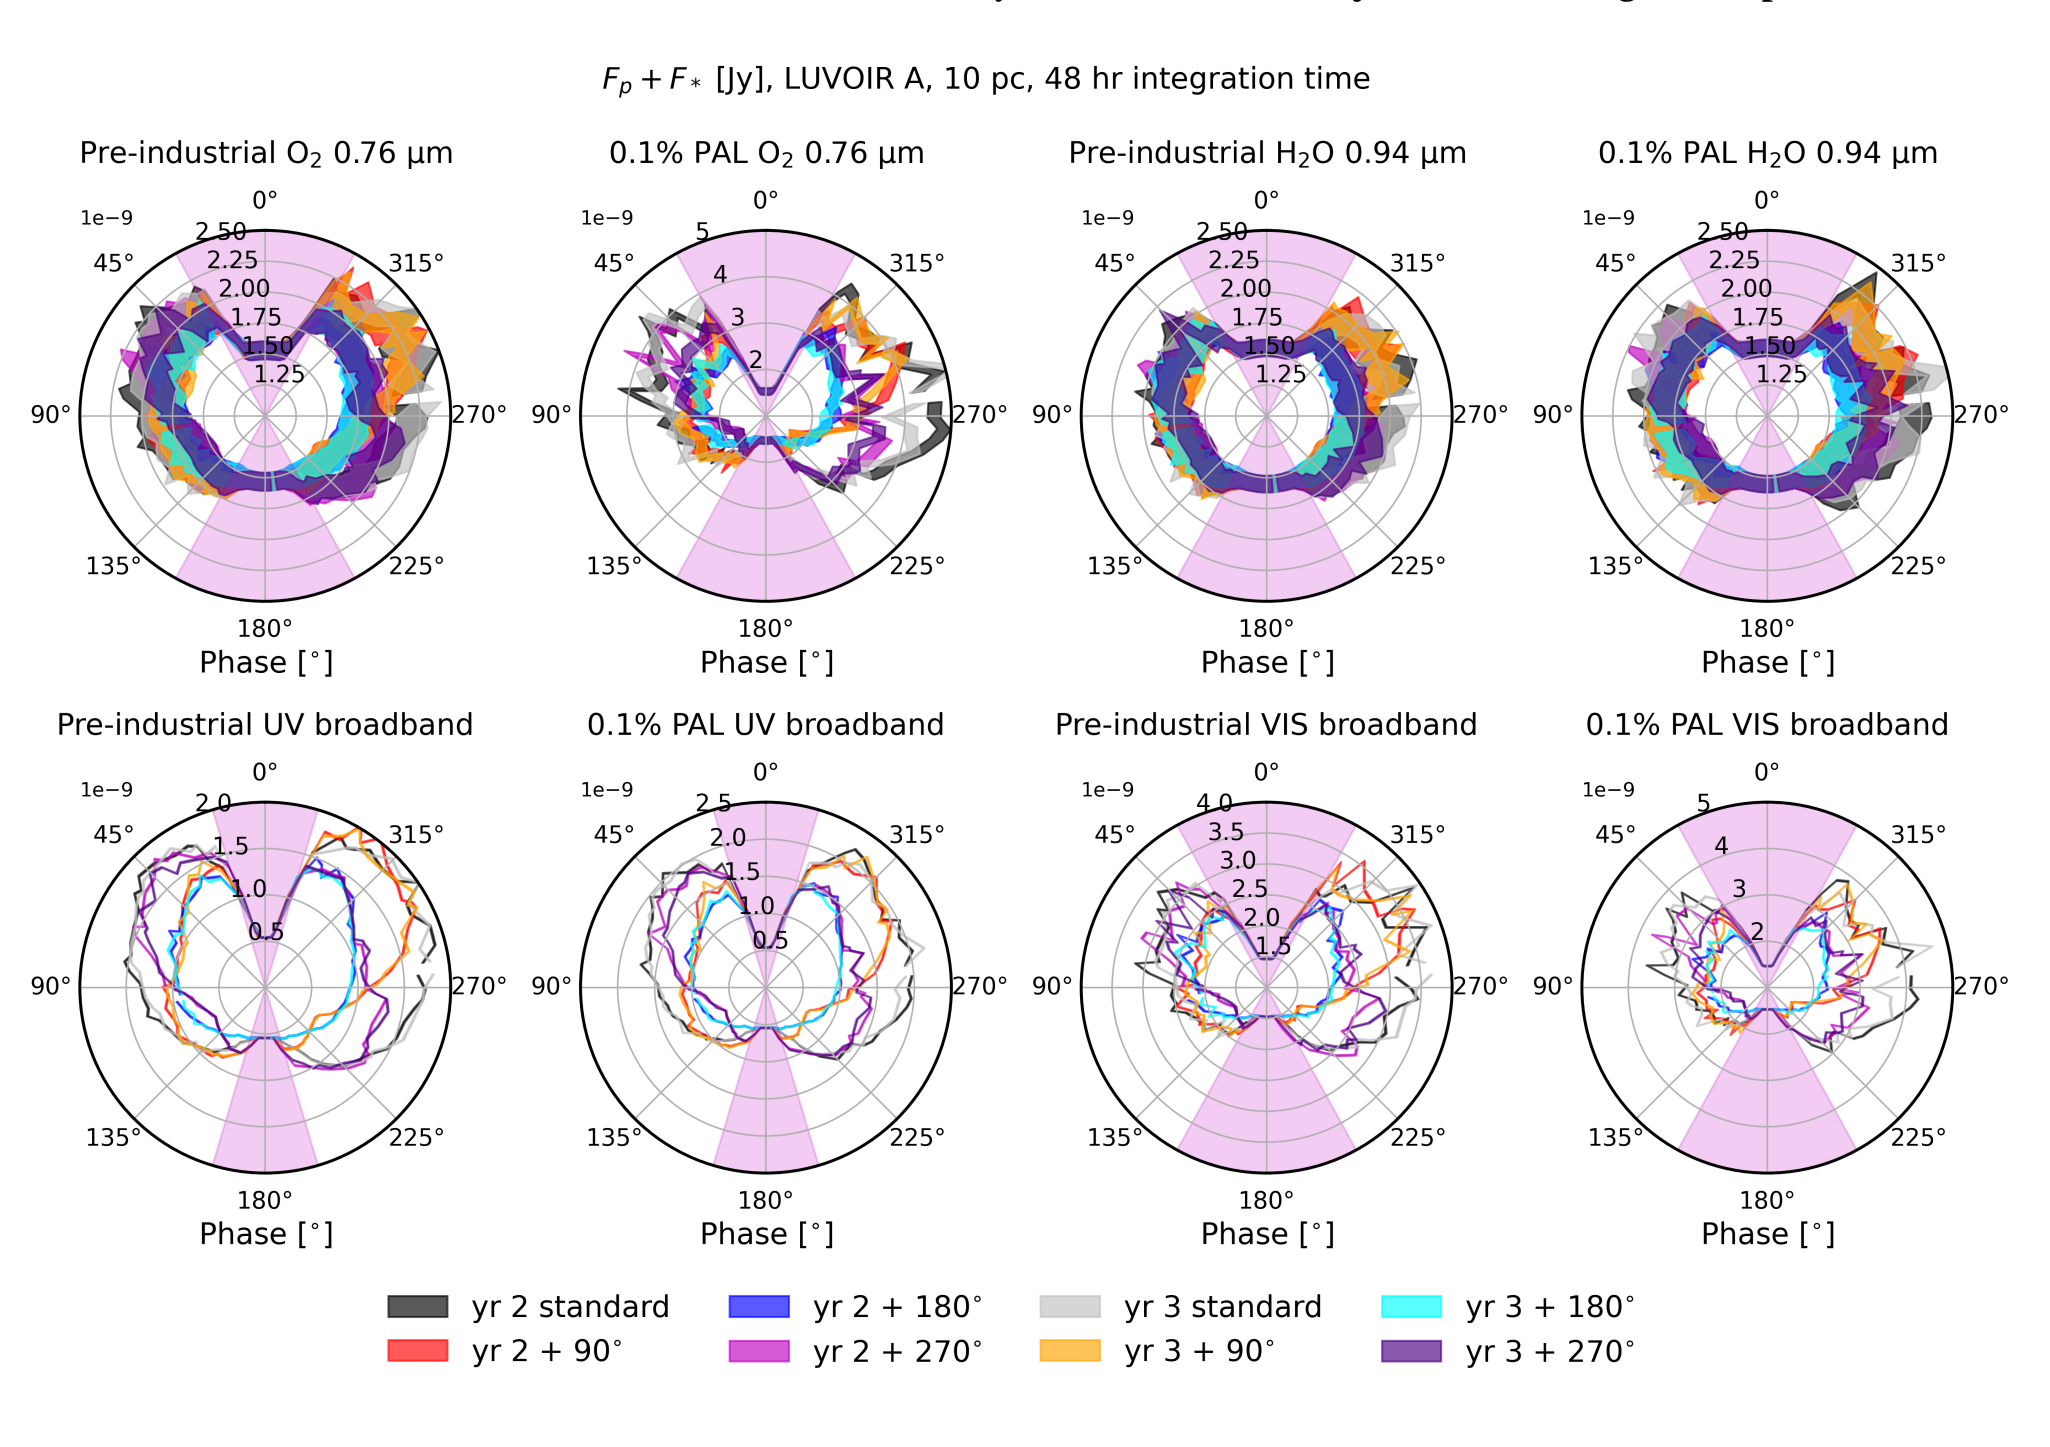
Using WACCM6, an Earth System Model, we simulate the atmosphere of Earth-analogue exoplanets with O2 mixing ratios between 0.1% and 150% PAL. Using these simulations, we calculate the reflection/emission spectra over multiple orbits using the Planetary Spectrum Generator.
We highlight how observer angle, albedo, chemistry, and clouds affect the simulated observations. We show that inter-annual climate variations, as well short-term variations due to clouds, can be observed in our simulated atmospheres with a telescope concept such as LUVOIR or HabEx.
Annual variability and seasonal variability can change the planet’s reflected flux (including the reflected flux of key spectral features such as O2 and H2O) by up to factors of 5 and 20, respectively, for the same orbital phase.
This variability is best observed with a high-throughput coronagraph. For example, HabEx (4 m) with a starshade performs up to a factor of two times better than a LUVOIR B (6 m) style telescope. The variability and signal-to-noise ratio of some spectral features depends non-linearly on atmospheric O2 concentration.
This is caused by temperature and chemical column depth variations, as well as generally increased liquid and ice cloud content for atmospheres with O2 concentrations of <1% PAL.
Gregory Cooke (1), Dan Marsh (1 and 2), Catherine Walsh (1), Sarah Rugheimer (3 and 4), Geronimo Villanueva (5) ((1) School of Physics and Astronomy, University of Leeds, UK, (2) National Center for Atmospheric Research, Boulder, USA, (3) University Oxford, Atmospheric, Oceanic, and Planetary Physics Department, UK, (4) Dept of Physics and Astronomy, York University, Canada, (5) NASA Goddard Space Flight Center, Solar System Exploration Division, USA)
Comments: 14 pages, 7 figures. Accepted for publication in MNRAS
Subjects: Earth and Planetary Astrophysics (astro-ph.EP)
Cite as: arXiv:2209.07566 [astro-ph.EP] (or arXiv:2209.07566v1 [astro-ph.EP] for this version)
https://doi.org/10.48550/arXiv.2209.07566
Focus to learn more
Submission history
From: Gregory Cooke
[v1] Thu, 15 Sep 2022 19:10:00 UTC (9,395 KB)
https://arxiv.org/abs/2209.07566
Astrobiology