New Map Of The Landscape Beneath Antarctica’s Ice Unveiled
Antarctica’s ice sheet has been assembled by a team of international scientists led from the British Antarctic Survey (BAS).
Known as Bedmap3, it incorporates more than six decades of survey data acquired by planes, satellites, ships and even dog-drawn sleds. The results are published this week (12 March) in the journal Scientific Data.
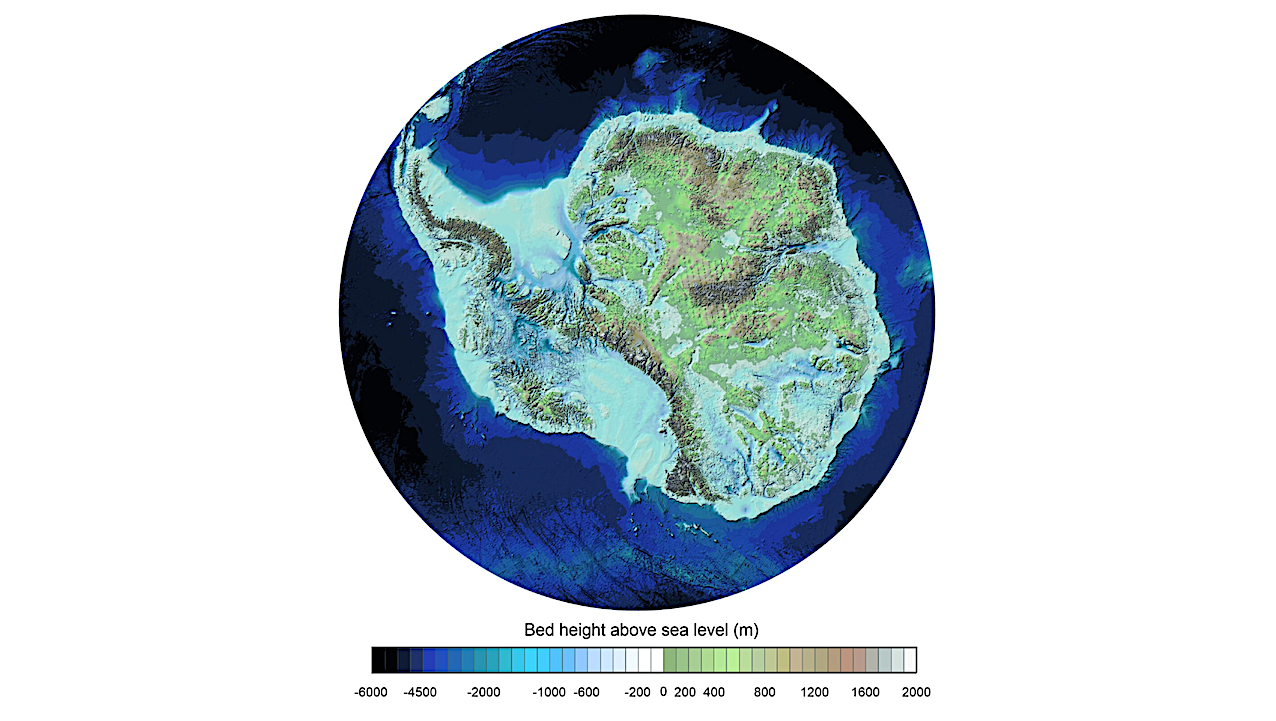
The map gives us a clear view of the white continent as if its 27 million cubic km of ice have been removed, revealing the hidden locations of the tallest mountains and the deepest canyons.
One notable revision to the map is the place understood to have the thickest overlying ice. Earlier surveys put this in the Astrolabe Basin, in Adélie Land. However, data reinterpretation reveals it is in an unnamed canyon at 76.052°S, 118.378°E in Wilkes Land. The ice here is 4,757 m thick, or more than 15 times the height of the Shard, the UK’s tallest skyscraper.
Bedmap3 is now set to become an essential tool in the quest to understand how Antarctica might respond to a warming climate, because it enables scientists to study interactions between the ice sheet and the bed.

Removing the 27 million cubic km of ice that covers Antarctica, the hidden locations of the tallest mountains are revealed. From Bedmap3 updated ice bed, surface and thickness gridded datasets for Antarctica by Pritchard, H., et al. — BAS
Dr Hamish Pritchard, a glaciologist at BAS and lead author on the study detailing the new map, says:
“This is the fundamental information that underpins the computer models we use to investigate how the ice will flow across the continent as temperatures rise. Imagine pouring syrup over a rock cake – all the lumps, all the bumps, will determine where the syrup goes and how fast. And so it is with Antarctica: some ridges will hold up the flowing ice; the hollows and smooth bits are where that ice could accelerate.”
Bedmap3, as the name suggests, is the third attempt to draw a picture of Antarctica’s rock bed that began in 2001, but this new effort represents a dramatic refinement. It includes more than double the number of previous data points (82 million), rendered on a 500 m grid spacing.
Big knowledge gaps have been filled by recent surveys in East Antarctica, including around the South Pole, along the Antarctic Peninsula and West Antarctic coastlines, and in the Transantarctic Mountains.
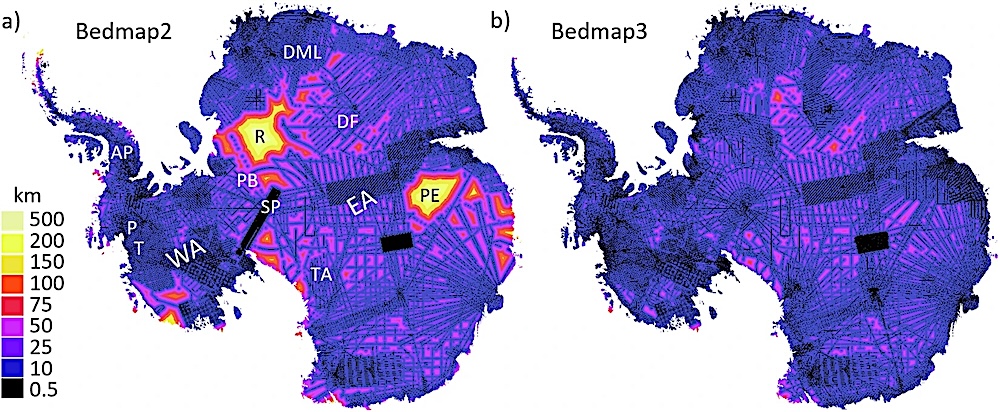
The survey coverage of Antarctica has improved since Bedmap2. This has decreased the distance from interpolated cells to ice thickness survey data (black lines) from that of (a) Bedmap2 (ref. 8) to that of (b) Bedmap3. P = Pine Island Glacier, T = Thwaites Glacier, R = Recovery Glacier, PE = Princess Elizabeth Land, SP = South Pole, PB = Pensacola Basin, DML = Dronning Maud Land, AP = Antarctic Peninsula, WA = West Antarctica, EA = East Antarctica, TA = Transantarctic Mountains, DF = Dome Fuji. — Scientific Data
The outline of deep valleys is better represented. So too are those places where rocky mountains stick up through the ice. The latest satellite data have also more accurately recorded the height and shape of the ice sheet and the thickness of the floating ice shelves that push out over the ocean at the continent’s margin.
The map also records a comprehensive new, continent wide view of grounding lines – the places where ice at the edge of the continent meets the ocean and and begins to float.
The landscape of the rock bed under Antarctica’s ice is sensed by a variety of techniques, including radar, seismic reflection (sound waves) and gravity measurements.
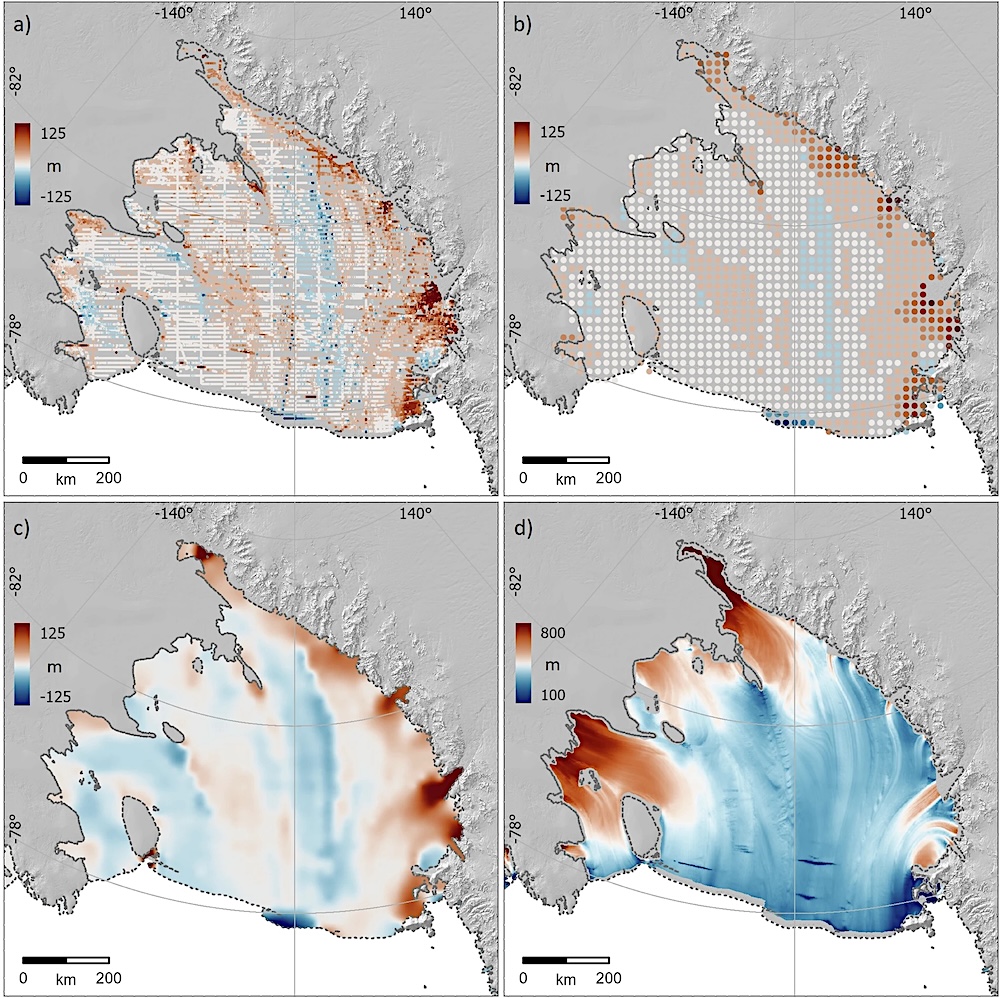
The Bedmap3 survey dataset allows us to calibrate the more continuous and extensive freeboard-based ice shelf thickness grid. (a) Pointwise ice thickness biases between 119,000 survey measurements and the freeboard-derived ice thickness grid47 on the Ross Ice Shelf, showing coherent patterns of bias; (b) these pointwise offsets median-filtered over a 20 km radius; (c) spline-interpolated calibration grid of the filtered offsets in (b); (d) bias-corrected version of the freeboard-derived ice thickness grid after subtraction of the calibration grid in (c). — Scientific Data
Subtracting this topography from the shape and elevation of the ice above provides some fascinating statistics on the polar south.
- Total volume of Antarctic ice, including ice shelves: 27.17 million cu km
- Total area of Antarctic ice, including ice shelves: 13.63 million sq km
- Mean thickness of Antarctic ice, including ice shelves: 1,948 m. (Excluding ice shelves: 2,148 m)
- Potential global sea-level rise if all ice melted: 58 m
Peter Fretwell, mapping specialist and co-author at BAS, says:
“In general, it’s become clear the Antarctic Ice Sheet is thicker than we originally realised and has a larger volume of ice that is grounded on a rock bed sitting below sea-level. This puts the ice at greater risk of melting due to the incursion of warm ocean water that’s occurring at the fringes of the continent. What Bedmap3 is showing us is that we have got a slightly more vulnerable Antarctica than we previously thought.”
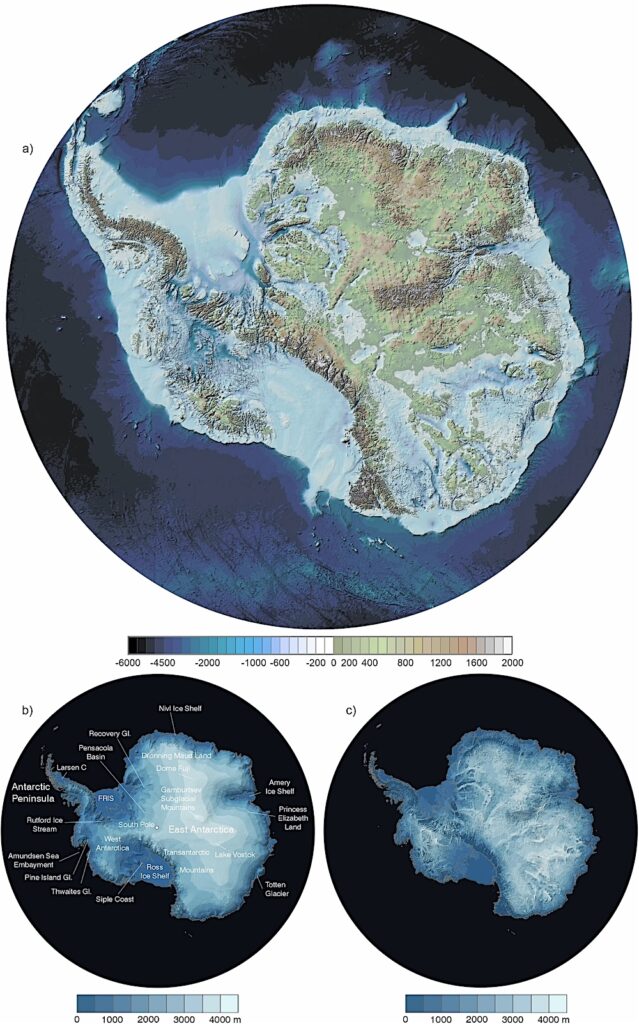
Bedmap3 grids of (a) bed topography and (b) surface elevation, in metres above sea level (g104c geoid), and (c) ice thickness in metres. Locations labelled in (b) are referred to in the text. — Scientific Data
New map of landscape beneath Antarctica unveiled, Scientific Data (open access)
Astrobiology