MAGellanic Outflow And Chemistry Survey (MAGOS): Hot Cores In The LMC
The Large Magellanic Cloud (LMC) provides a key laboratory for exploring the diversity of star formation and interstellar chemistry under subsolar metallicity conditions.
We present the results of a hot core survey toward 30 massive protostellar objects in the LMC using the Atacama Large Millimeter/submillimeter Array (ALMA) at 350 GHz. Continuum imaging reveals 36 compact sources in total, among which line analyses identify 9 hot cores and 1 hot-core candidate, including two newly identified sources. We detect CO, HCO+, H13CO+, HC15N, HC3N, SiO, SO, SO+, NS, SO2, 34SO2, 33SO2, CH3OH, 13CH3OH, HCOOH, HCOOCH3, CH3OCH3, C2H5OH, H2CCO (tentative), and hydrogen recombination lines from hot cores.
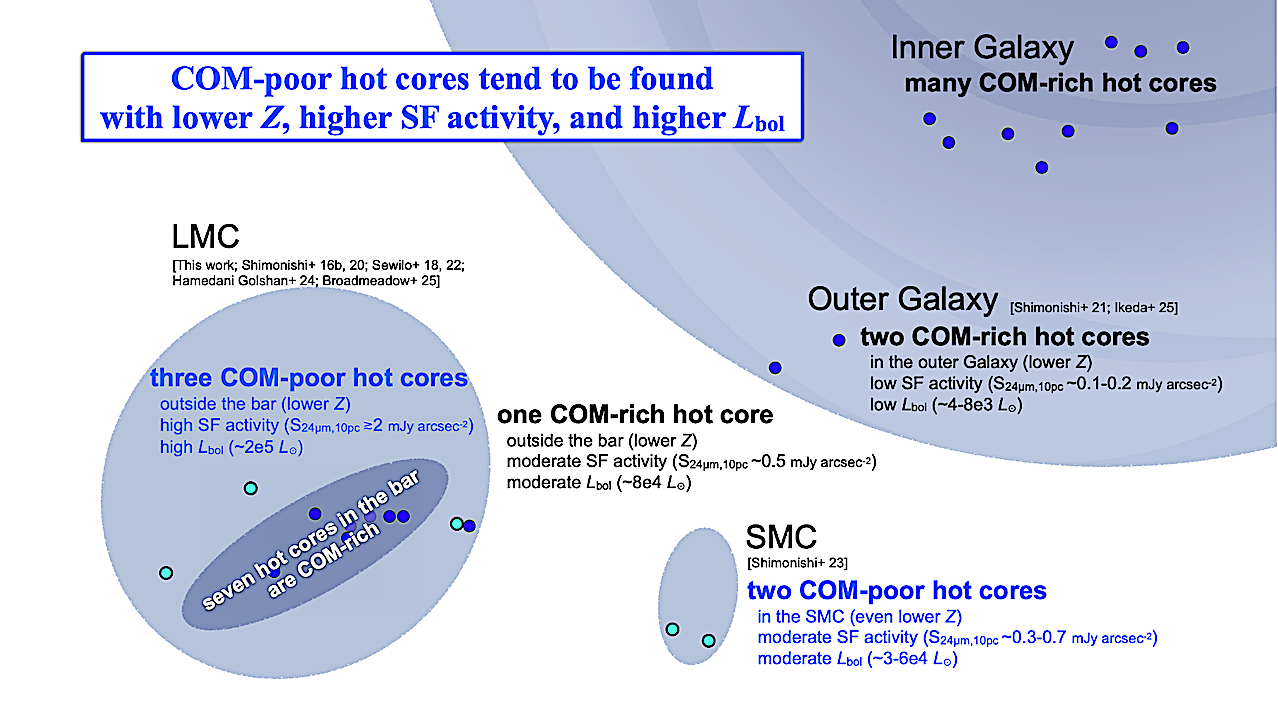
CH3OCH3, a complex organic molecule larger than CH3OH, is detected for the first time in a hot core outside the LMC bar region. All hot cores show stronger emission in the high-excitation SO line compared to non-hot-core sources, suggesting that its strong detection will be useful for identifying hot-core candidates in the LMC. Chemical analysis reveals a spread of more than two orders of magnitude in CH3OH abundances, with some sources deficient in COMs.
In contrast, SO2 is detected in all hot cores, and its abundance shows a good correlation with rotational temperature. The hot cores without CH3OH detections are all located outside the LMC bar region and are characterized by either high luminosity or active star formation in their surroundings. A combination of locally low metallicity, active star formation in the vicinity, and high protostellar luminosity may jointly trigger the COM-poor hot core chemistry observed in the LMC.
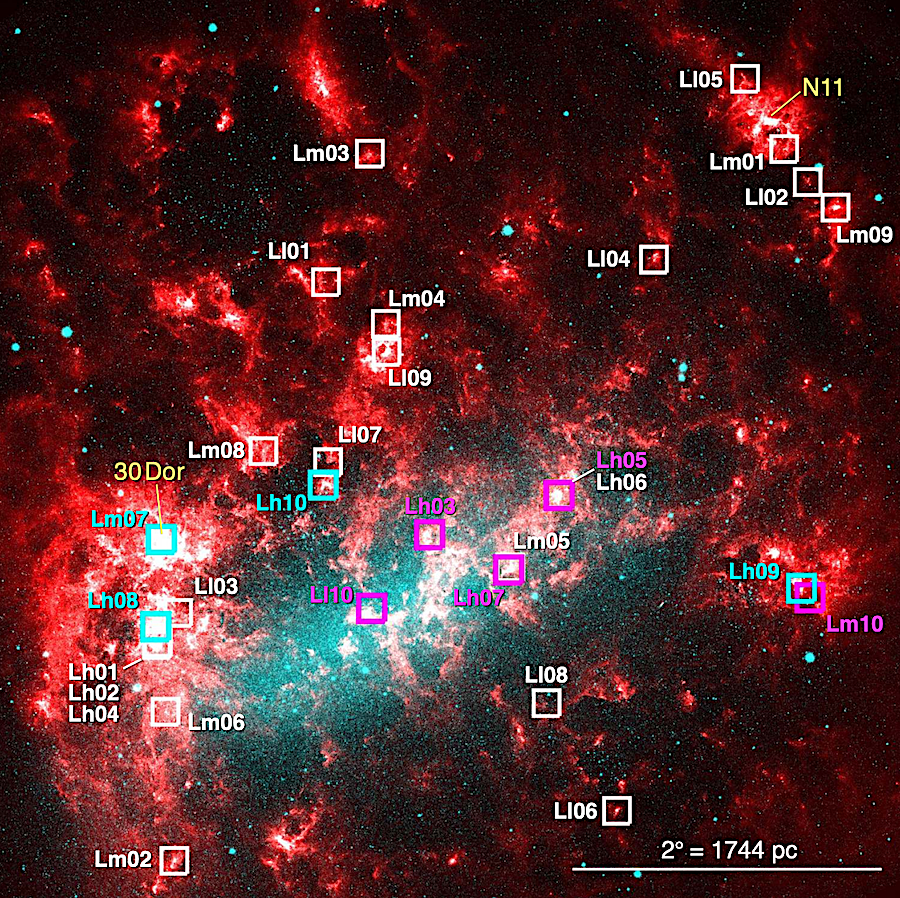
Spatial distribution of the observed massive protostars in the LMC. Hot cores with CH3OH detection are indicated by magenta squares, those without CH3OH detection are by cyan squares (including one hot core candidate), and the remaining sources are shown in white (see Section 5.1 for details). The background is a two-color image: light blue represents Spitzer/IRAC 3.6 µm data and red represents Herschel/PACS 160 µm data (Meixner et al. 2006, 2010). The 3.6 µm emission mainly traces the stellar distribution, while the 160 µm emission traces the distribution of the ISM. The location of the 30 Dor and N11 regions are labeled in yellow. North is up, and east is to the left. — astro-ph.GA
Takashi Shimonishi, Kei E. I. Tanaka, Yichen Zhang, Kenji Furuya, Yu Cheng, Asako Sato
Comments: Accepted for publication in ApJS, 38 pages, 28 figures, 4 tables
Subjects: Astrophysics of Galaxies (astro-ph.GA)
Cite as: arXiv:2512.15983 [astro-ph.GA] (or arXiv:2512.15983v1 [astro-ph.GA] for this version)
https://doi.org/10.48550/arXiv.2512.15983
Focus to learn more
Submission history
From: Takashi Shimonishi
[v1] Wed, 17 Dec 2025 21:27:19 UTC (16,243 KB)
https://arxiv.org/abs/2512.15983
Astrobiology, Exoplanet, astrochemistry,