JWST Reveals Spectral Tracers of Recent Surface Modification on Europa
Europa has been modified by a variety of geologic processes, exposing internally-derived materials that are heavily irradiated by charged particles trapped in Jupiter’s magnetosphere.
Prior spectral analysis of H2O ice on Europa relied on low signal-to-noise data at wavelengths >2.5 microns, limiting assessment of a 3.1 micron Fresnel peak that is diagnostic of exposed crystalline ice.
We report new measurements of H2O ice spectral features using high signal-to-noise data collected by the NIRSpec spectrograph (1.48 – 5.35 microns) on the James Webb Space Telescope. These data reveal a narrow 3.1 micron crystalline H2O ice Fresnel peak, which is primarily located at southern latitudes in Tara and Powys Regiones.
Our analysis indicates that crystalline ice exposed in these low-latitude regiones is likely sustained by ongoing thermal (re)crystallization outpacing charged particle amorphization of the top 10 microns of Europa’s regolith over short timescales (<15 days).
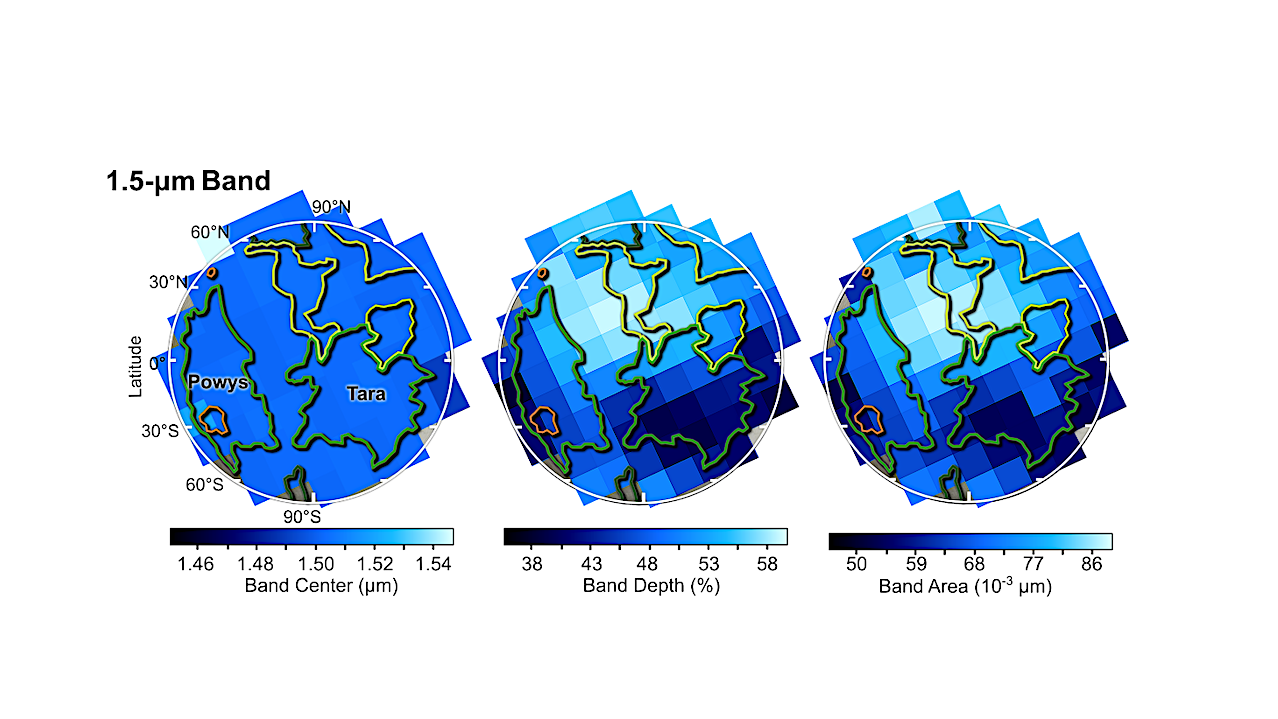
We also measured H2O ice features centered near 1.5 microns, 1.65 microns, and 2.0 microns, and a broad 3.6 micron H2O continuum peak, which are all stronger at northern latitudes, in contrast to the 3.1 micron Fresnel peak identified at southern latitudes.
These results support the hypothesis that H2O ice in Europa’s regolith is vertically stratified, with amorphous ice grains dominating its exposed surface, except in Tara and Powys Regiones.
We also find that a previously detected 4.38 micron 13O2 feature is present almost exclusively at southern latitudes in Tara and Powys Regiones, likely derived from an internal source of carbon-bearing material.
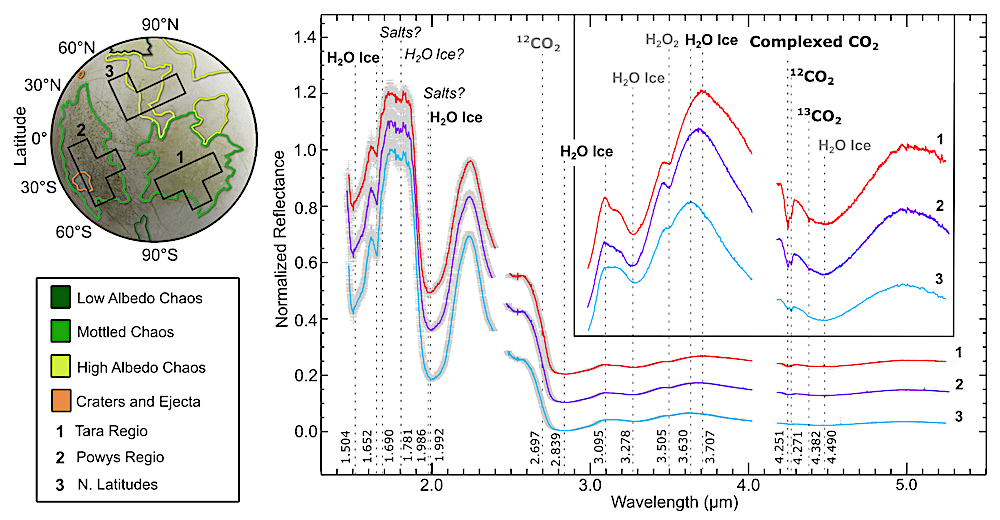
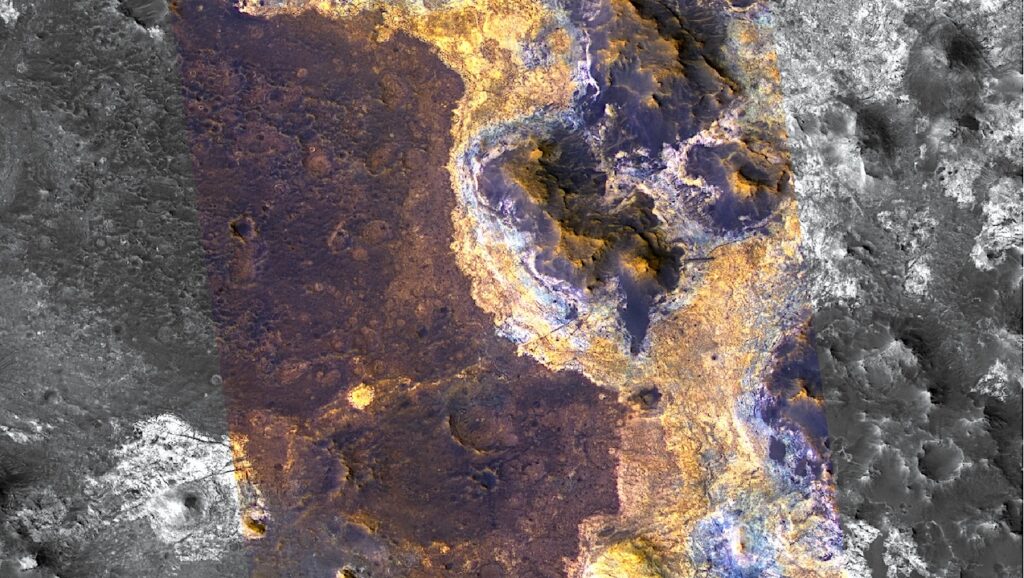
Left: Mosaic of Europa’s leading hemisphere, made with images collected by Galileo’s Solid State Imager, overlain by mapping of previously defined geologic features (Leonard et al. 2024). Black polygons show the locations of JWST/NIRSpec spaxels incorporated into the spectra shown on the right. Geologic units are defined in the legend below (utilizing a similar color scheme to Leonard et al. 2024). Right: JWST/NIRSpec spectra and 1σ uncertainties of Europa, representative of southern/central Tara Regio (red, 1), southern Powys Regio (purple, 2), and a northern low-latitude region dominated by ridges and bright terrains (cyan, 3). These spectra were generated by median-combining the four spaxels in each polygon shown in the map on the left, normalized to one between 1.77 and 1.78 µm and offset vertically for clarity. The inset figure shows the same data, between 3 and 5.3 µm, normalized to one between 3.14 and 3.15 µm and offset vertically. Confirmed absorption bands associated with H2O ice, solid-state CO2, and H2O2, and the 3.1 µm H2O ice Fresnel peak and 3.6 µm H2O ice continuum peak are labeled (bolded text). Spectral features that might include contributions from hydrated minerals, such as sulfates (De Angelis et al. 2021), chlorides (e.g., De Angelis et al. 2022), and carbonates (e.g., De Angelis et al. 2019), are labeled “salts?” (italicized text). Central wavelengths (µm) for these confirmed and possible features are listed vertically along each dotted line. Constituents labeled in gray font are shown here for completeness but were not measured by this study. Subtle spectral features between 4.7 and 5.1 µm could be artifacts, and we did not analyze them in this study. — astro-ph.EP

Spectral maps illustrating the distribution in the band centers, depths, and areas for (top) Europa’s 1.5 µm band (1.48 – 1.74 µm), (middle) its 1.65 µm band (1.62 – 1.68 µm), and (bottom) its 2.0 µm band (1.86 – 2.24 µm), each primarily attributed to H2O ice. The 1σ uncertainties for the spectral contrast measurements range between: 0.37 – 0.57%, 0.75 – 1.11%, and 0.10 – 1.00%, for the 1.5 µm, 1.65 µm, and 2.0 µm bands, respectively. The 1σ uncertainties for the area measurements are 0.12 – 0.32 µm, 0.11 – 0.21 µm, and 0.08 – 0.88 µm for the 1.5 µm, 1.65 µm, and 2.0 µm bands, respectively. The spatial extents of large-scale geologic units on Europa’s leading and anti-Jovian sides, including Tara (10◦S, 75◦W) and Powys (0◦, 145◦W) Regiones are indicated and described in the included legend (see Leonard et al. 2024). — astro-ph.EP
Richard J. Cartwright, Charles A. Hibbits, Bryan J. Holler, Ujjwal Raut, Tom A. Nordheim, Marc Neveu, Silvia Protopapa, Christopher R. Glein, Erin J. Leonard, Lorenz Roth, Chloe B. Beddingfield, Geronimo L. Villanueva
Comments: Accepted in AAS Planetary Science Journal, April 7 2025
Subjects: Earth and Planetary Astrophysics (astro-ph.EP)
Cite as: arXiv:2504.05283 [astro-ph.EP] (or arXiv:2504.05283v1 [astro-ph.EP] for this version)
https://doi.org/10.48550/arXiv.2504.05283
Focus to learn more
Submission history
From: Richard Cartwright
[v1] Mon, 7 Apr 2025 17:32:42 UTC (13,755 KB)
https://arxiv.org/abs/2504.05283
Astrobiology