Three-Dimensional Venus Cloud Structure Simulated by a General Circulation Model
The clouds have a great impact on Venus’s energy budget and climate evolution, but its three-dimensional structure is still not well understood. Here we incorporate a simple Venus cloud physics scheme into a flexible GCM to investigate the three-dimensional cloud spatial variability.
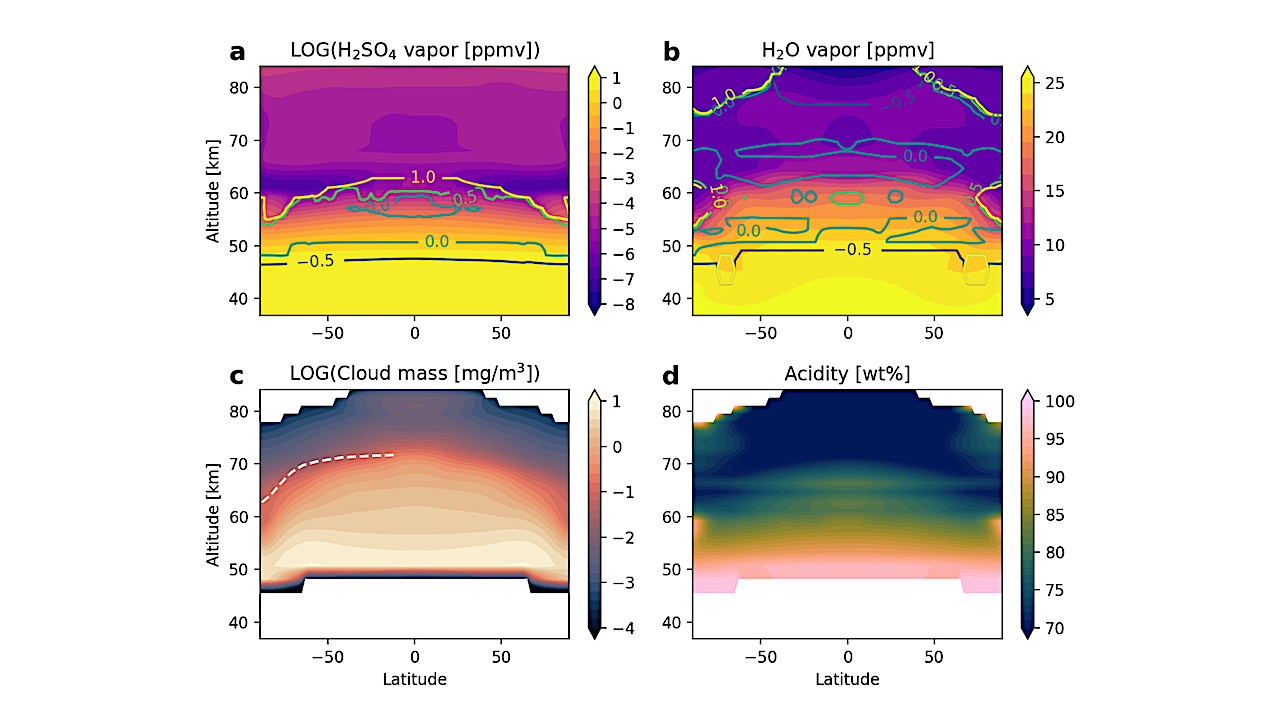
Our simulations show good agreement with observations in terms of the vertical profiles of clouds and H2SO4 vapor. H2O vapor is overestimated above the clouds due to efficient transport in the cloud region. The cloud top decreases as latitude increases, qualitatively consistent with Venus Express observations.
The underlying mechanism is the combination of H2SO4 chemical production and meridional circulation. The mixing ratios of H2SO4 at 50-60 km and H2O vapors in the main cloud deck basically exhibit maxima around the equator, due to the effect of temperature’s control on the saturation vapor mixing ratios of the two species.
The cloud mass distribution is subject to both H2SO4 chemical production and dynamical transport and shows a pattern that peaks around the equator in the upper cloud while peaks at mid-high latitudes in the middle cloud. At low latitudes, H2SO4 and H2O vapors, cloud mass loading and acidity show semidiurnal variations at different altitude ranges, which can be validated against future missions.
Our model emphasizes the complexity of the Venus climate system and the great need for more observations and simulations to unravel its spatial variability and underlying atmospheric and/or geological processes.
Wencheng D. Shao, João M. Mendonça, Longkang Dai
Comments: 34 pages, 8 figures, 8 supporting figures. Accepted by JGR-Planets
Subjects: Earth and Planetary Astrophysics (astro-ph.EP); Space Physics (physics.space-ph)
Cite as: arXiv:2407.15966 [astro-ph.EP (or arXiv:2407.15966v1 [astro-ph.EP] for this version)
Related DOI:
https://doi.org/10.1029/2023JE008088
Focus to learn more
Submission history
From: Wencheng Shao
[v1] Mon, 22 Jul 2024 18:27:11 UTC (5,813 KB)
https://arxiv.org/abs/2407.15966
Astrobiology,