Biogenic Sulfur Gases As Biosignatures On Temperate Sub-Neptune Waterworlds
Theoretical predictions and observational data indicate a class of sub-Neptune exoplanets may have water-rich interiors covered by hydrogen-dominated atmospheres. Provided suitable climate conditions, such planets could host surface liquid oceans.
Motivated by recent JWST observations of K2-18 b, we self-consistently model the photochemistry and potential detectability of biogenic sulfur gases in the atmospheres of temperate sub-Neptune waterworlds for the first time. On Earth today, organic sulfur compounds produced by marine biota are rapidly destroyed by photochemical processes before they can accumulate to significant levels. Shawn et al. (2011) suggest that detectable biogenic sulfur signatures could emerge in Archean-like atmospheres with higher biological production or low UV flux.
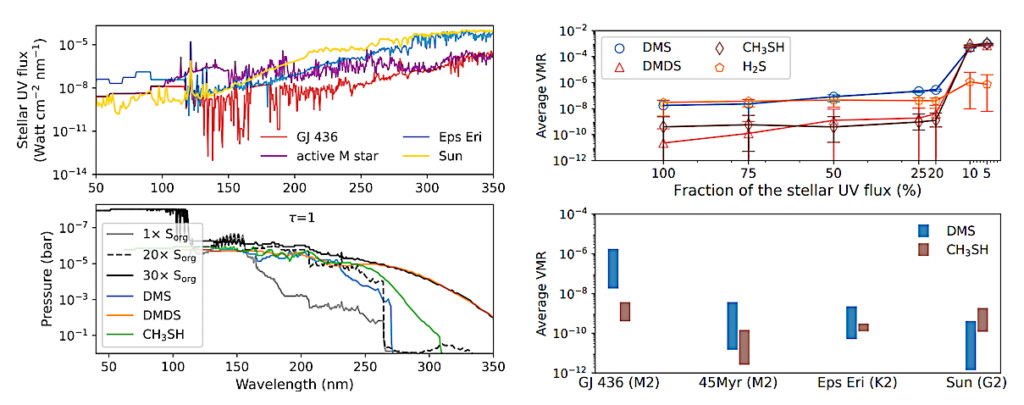
Left: The stellar spectra in the UV for GJ 436 (M2.5), a young (45 Myr) and active M star, Epsilon Eridani, and the Sun in the top panel. The spectra of GJ 436 and Epsilon Eridani are from the MUSCLES survey (version 2.2) (France et al. 2016; Youngblood et al. 2016; Loyd et al. 2016), the active M star spectrum is from HAZMAT (Peacock et al. 2020), and the solar spectrum is from Gueymard (2018). The lower panel shows the UV photosphere (τ = 1) with different Sorg. The contributions from DMS, DMDS, and CH3SH are further displayed for the 30× Sorg model. Right: The upper panel shows the average VMRs of several sulfur species as a function of attenuating total stellar UV flux for Earth’s Sorg flux. The bottom panel shows the span of abundance averaged between 1 and 10−4 bar for 1× – 20× Sorg flux around different stellar types. — astro-ph.EP
In this study, we explore biogenic sulfur across a wide range of biological fluxes and stellar UV environments. Critically, the main photochemical sinks are absent on the nightside of tidally locked planets. To address this, we further perform experiments with a 3D GCM and a 2D photochemical model (VULCAN 2D (Tsai et al. 2024)) to simulate the global distribution of biogenic gases to investigate their terminator concentrations as seen via transmission spectroscopy. Our models indicate that biogenic sulfur gases can rise to potentially detectable levels on hydrogen-rich water worlds, but only for enhanced global biosulfur flux (≳20 times modern Earth’s flux).
We find that it is challenging to identify DMS at 3.4 μm where it strongly overlaps with CH4, whereas it is more plausible to detect DMS and companion byproducts, ethylene (C2H4) and ethane (C2H6), in the mid-infrared between 9 and 13 μm.
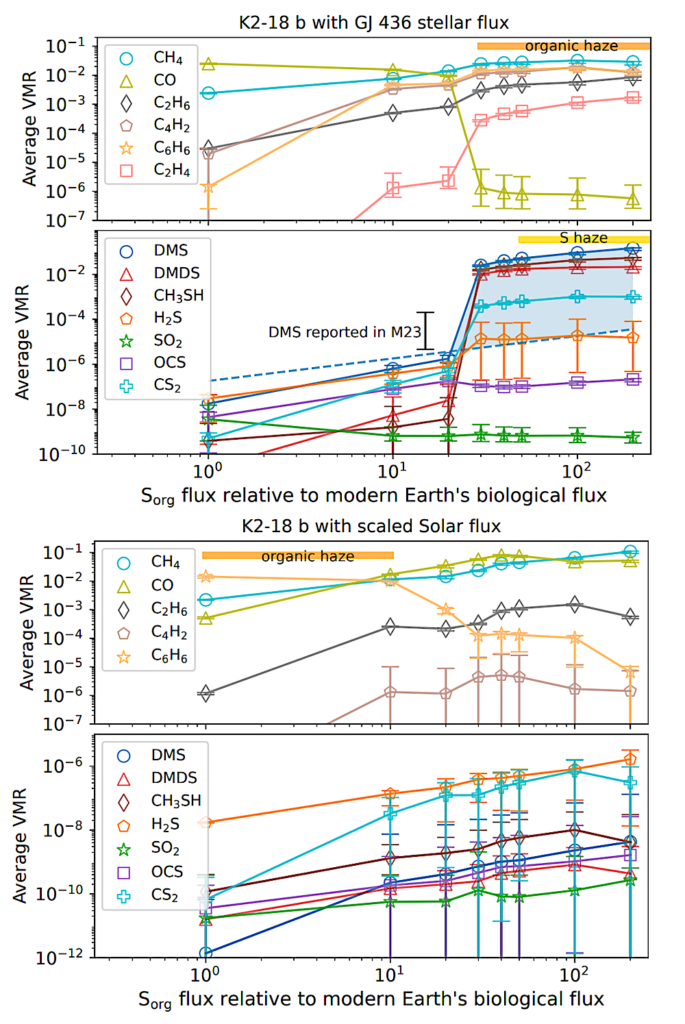
The average volume mixing ratios (VMRs) as a function of sulfur biological flux (Sorg). We adopt the stellar spectrum of GJ 436 as an analogous star to K2-18 for our nominal Hycean K2-18 b model (top). Additionally, we scaled the solar flux to match an equivalent flux (bottom). Open circles are the average VMRs across the 1 to 10−4 bar pressure range, whereas error bars denote the full span of VMRs within this pressure range. The dashed line represents the limit of DMS given by surface deposition with 0.01 cm−1 dry deposition velocity. Combined with the deposition-free DMS abundances in our model, the shaded blue region illustrates the upper and lower bounds of DMS abundance. The black error bar marks the reported DMS VMR from Madhusudhan et al. (2023) (M23). The orange band highlights the regime where hydrocarbon haze precursors, C4H2 and C6H6, exceed 1%. Similarly, the yellow band highlights the regime where elemental sulfur (S8) becomes saturated and condenses. — astro-ph.EP
Shang-Min Tsai, Hamish Innes, Nicholas F. Wogan, Edward W. Schwieterman
Comments: 9 pages, 4 figures, revised after the initial review
Subjects: Earth and Planetary Astrophysics (astro-ph.EP)
Cite as: arXiv:2403.14805 [astro-ph.EP] (or arXiv:2403.14805v1 [astro-ph.EP] for this version)
Submission history
From: Shang-Min Tsai
[v1] Thu, 21 Mar 2024 19:35:27 UTC (1,369 KB)
https://arxiv.org/abs/2403.14805
Astrobiology,