Constraints On Triton’s Atmospheric Evolution From Occultations: 1989-2022
Context – Around the year 2000, Triton’s south pole experienced an extreme summer solstice that occurs every about 650 years, when the subsolar latitude reached about 50°. Bracketing this epoch, a few occultations probed Triton’s atmosphere in 1989, 1995, 1997, 2008 and 2017. A recent ground-based stellar occultation observed on 6 October 2022 provides a new measurement of Triton’s atmospheric pressure which is presented here.
Aims- The goal is to constrain the Volatile Transport Models (VTMs) of Triton’s atmosphere that is basically in vapor pressure equilibrium with the nitrogen ice at its surface.
Methods – Fits to the occultation light curves yield Triton’s atmospheric pressure at the reference radius 1400 km, from which the surface pressure is induced.
Results – The fits provide a pressure p_1400= 1.211 +/- 0.039 microbar at radius 1400 km (47 km altitude), from which a surface pressure of p_surf= 14.54 +/- 0.47 microbar is induced (1-sigma error bars). To within error bars, this is identical to the pressure derived from the previous occultation of 5 October 2017, p_1400 = 1.18 +/- 0.03 microbar and p_surf= 14.1 +/- 0.4 microbar, respectively. Based on recent models of Triton’s volatile cycles, the overall evolution over the last 30 years of the surface pressure is consistent with N2 condensation taking place in the northern hemisphere. However, models typically predict a steady decrease in surface pressure for the period 2005-2060, which is not confirmed by this observation. Complex surface-atmosphere interactions, such as ice albedo runaway and formation of local N2 frosts in the equatorial regions of Triton could explain the relatively constant pressure between 2017 and 2022.
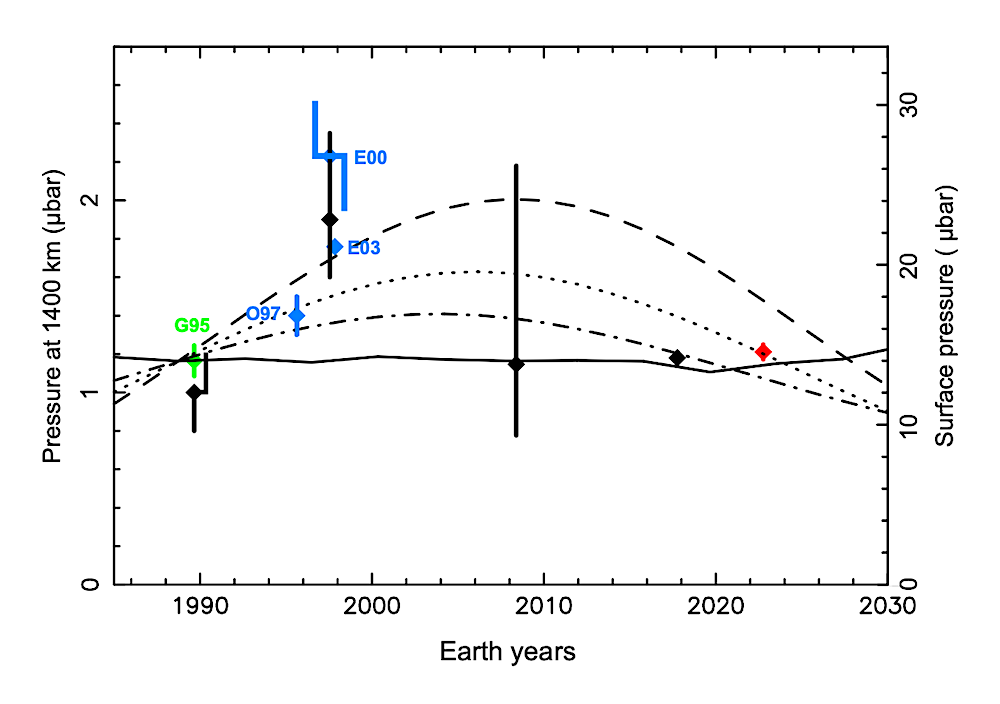
Evolution of Triton’s atmospheric pressure from occultation measurements taken between 1989 and 2022; see dates and values in Table 1. The red point is the result of the 6 October 2022 occultation (this work). It has been obtained using the same method as adopted by MO22 (black points). The green point (G95) is from the V2 RSS occultation of 25 August 1989 (Gurrola 1995). The blue points are respectively: O97, ground-based stellar occultation, 14 August 1995 (Olkin et al. 1997); E03, ground-based stellar occultation, 18 July 1997 (Elliot et al. 2000); E00, HST-based stellar occultation, 4 November 1997 (Elliot et al. 2003). It should be noted that MO22 analyzed the RSS data of August 1989 and the occultation data of July 1997 independently of Gurrola (1995) and (Elliot et al. 2000), respectively.
The vertical axes show the pressures at the reference radius 1400 km (left) and at the surface (right), assuming psurf/p1400 = 12.01, see text. The lines are examples of VTM simulations by Bertrand et al. (2022). Dashed-dotted line: southern cap within 90◦S-30◦S, northern cap within 45◦N-90◦N; Dotted line: southern cap within 90◦S30◦S, northern cap within 60◦N-90◦N; Dashed line: southern cap within 90◦S-30◦S, no northern cap (volatile-free northern hemisphere); solid line: a simulation where the N2 ice freely evolves over millions of years so that permanent and seasonal polar caps as well as local frosts deposits can form self-consistently. In this simulation, formation of thin seasonal N2 frosts is predicted in the current southern summer in the equatorial regions.
None of the simulations satisfactorily fits the data. The dashed line accounts for the pressure increase of 1995-1997 but overestimates the pressures measured in 2017 and 2022. The dotted line marginally explains the increase of 1995-1997 and satisfactorily fit the 2022 measurement, but fails to explain the 2017 point. The dashed-dotted line does not fit the increase of 1995-1997, while going through the 2017 point, but fails to explain the 2022 point. The solid line accounts for a basically constant pressure between 1989, 2017 and 2022, as well as the slight increases between 2017 and 2022. However, it is only marginally consistent with the 1995 result, and does not account for the pressure surge of 1997.
B. Sicardy, A. Tej, A. R. Gomes-Junior, F. D. Romanov, T. Bertrand, N. M. Ashok, E. Lellouch, B. E. Morgado, M. Assafin, J. Desmars, J. I. B. Camargo, Y. Kilic, J. L. Ortiz, R. Vieira-Martins, F. Braga-Ribas, J. P. Ninan, B. C. Bhatt, S. Pramod Kumar, V. Swain, S. Sharma, A. Saha, D. K. Ojha, G. Pawar, S. Deshmukh, A. Deshpande, S. Ganesh, J. K. Jain, S. K. Mathew, H. Kumar, V. Bhalerao, G. C. Anupama, S. Barway, A. Brandeker, H. G. Floren, G. Olofsson, G. Bruno, Y. M. Mao, R. H. Ye, Q. Y. Zou, Y. K. Sun, Y. Y. Shen, J. Y. Zhao, D. N. Grishin, L. V. Romanova, F. Marchis, K. Fukui, R. Kukita, G. Benedetti-Rossi, P. Santos-Sanz, N. Dhyani, A. Gokhale, A. Kate
Comments: 8 pages, 4 figures, accepted for publication in Astronomy and Astrophysics
Subjects: Earth and Planetary Astrophysics (astro-ph.EP)
Cite as: arXiv:2402.02476 [astro-ph.EP] (or arXiv:2402.02476v1 [astro-ph.EP] for this version)
Submission history
From: Bruno Sicardy Prof.
[v1] Sun, 4 Feb 2024 13:13:05 UTC (2,105 KB)
https://arxiv.org/abs/2402.02476
Astrobiology