How To Infer Ocean Freezing Rates On Icy Satellites From Measurements Of Ice Thickness
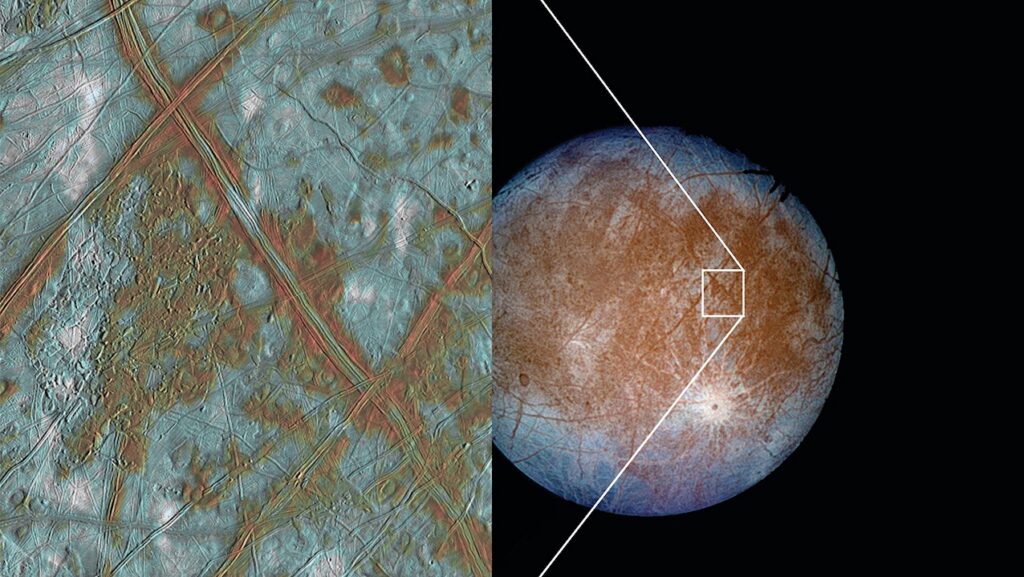
Liquid water oceans are thought to underlie the ice shells of Europa and Enceladus. However, ocean properties can be challenging to measure due to the overlying ice cover.
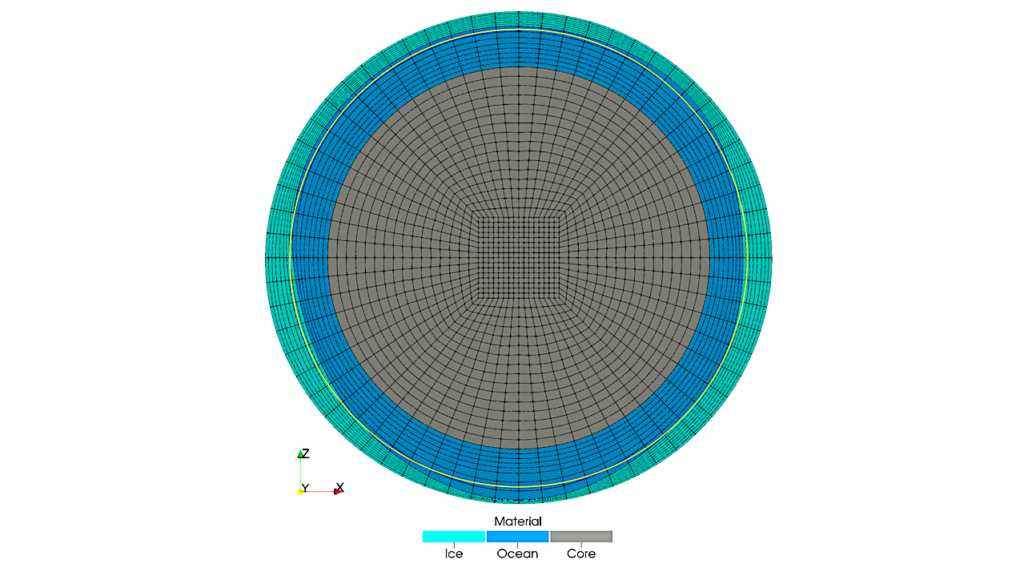
Here, we explore how measurements of ice shell thickness, which may be easier to obtain, could be used to infer information about the subsurface ocean. In particular, we consider lateral gravity-driven flow of the ice shells of icy satellites and relate this to ocean freeze and melt rates. We employ a first-principles approach applicable to conductive ice shells. We derive a scaling law under which ocean freeze and melt rates can be estimated from thickness measurements of a shell with a vertically-varying temperature-dependent viscosity.
Under a steady-state assumption, ocean freeze and melt rates can be inferred from measurements of ice thickness; however, these rates depend on the basal viscosity, a key unknown. Depending on a characteristic thickness scale and basal viscosity, the characteristic freeze and melt rates range from about O(10−1) to O(10−5) mm/year.
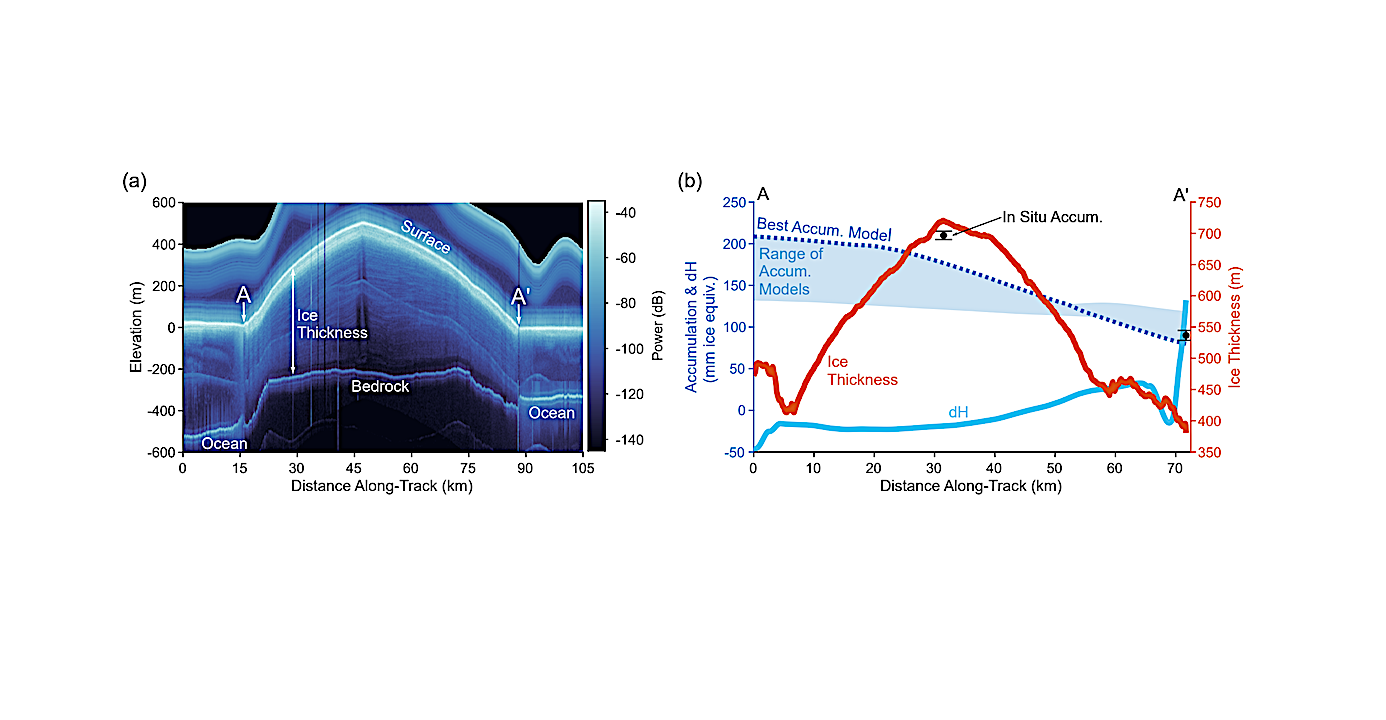
We validate our scaling in an Earth environment with ice-penetrating radar measurements of ice thickness and modelled snow accumulation for Roosevelt Island, Antarctica. Our model, coupled with the forthcoming observations of shell thickness from upcoming missions, may help bound the magnitudes of estimated ocean freeze and melt rates on icy satellites and shed light on potential ocean stratifications.
Nicole C. Shibley, Ching-Yao Lai, Riley Culberg
Comments: 21 pages, 4 figures
Subjects: Earth and Planetary Astrophysics (astro-ph.EP)
Cite as: arXiv:2310.02404 [astro-ph.EP] (or arXiv:2310.02404v1 [astro-ph.EP] for this version)
Submission history
From: Nicole Shibley
[v1] Tue, 3 Oct 2023 19:57:42 UTC (4,405 KB)
https://arxiv.org/abs/2310.02404
Astrobiology