Metagenomics Untangles Metabolic Adaptations Of Antarctic Endolithic Bacteria At The Fringe Of Habitability
Background: Endolithic niches offer an ultimate refuge, supplying buffered conditions for microorganisms that dwell inside rock airspaces. Yet, survival and growth strategies of Antarctic endolithic microbes residing in Earths’ driest and coldest desert remains virtually unknown.
Results: From 109 endolithic microbiomes, 4,539 metagenome-assembled genomes were generated, 49.3% of which were novel candidate bacterial species. We present evidence that trace gas oxidation and atmospheric chemosynthesis may be the prevalent strategies supporting metabolic activity and persistence of these ecosystems at the fringe of life and the limits of habitability.
Conclusions: These results represent the foundation to untangle adaptability at the edge of sustainability on Earth and on other dry Earth-like planetary bodies such as Mars.
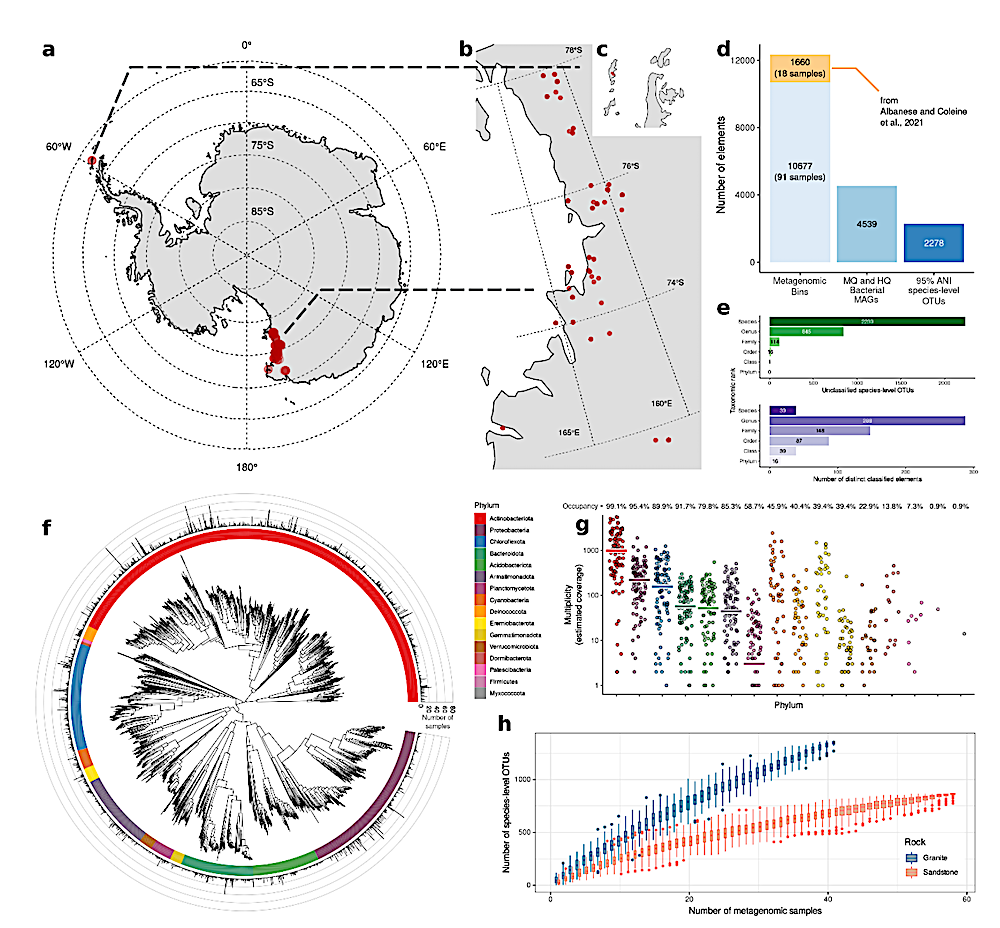
a-c, Map of Antarctica (a) and sampling sites (Victoria Land, b; Peninsula, c) (red dots). d, Number of MAGs and their quality-based classification. e, Upper bar plot: number of unclassified OTUs. Bottom bar plot: number of species, genera, families, orders, classes and phyla. f, Phylogenetic tree of the 2,278 OTUs built from the multiple sequence alignment of 120 GTDB marker genes. Barplot in the outer circle indicates the number of samples in which each OTUs was found. g, Phylum-level Mash Screen multiplicity for each sample, indicating sequence coverage. Horizontal lines represent the median values. The occupancy value indicates the percentage of samples that contains the underlying phylum. h, Number of OTUs as a function of the number of rock samples. — biorxiv.org
doi: https://doi.org/10.1101/2023.07.30.551190
https://www.biorxiv.org/content/10.1101/2023.07.30.551190v1, biorxiv.org
Astrobiology