PRODIGE – Envelope To Disk With NOEMA VII. (Complex) Organic Molecules In The NGC1333 IRAS 4B1 Outflow: A New Laboratory For Shock Chemistry

Context. Shock chemistry is an excellent tool for shedding light on the formation and destruction mechanisms of complex organic molecules (COMs). The L1157-mm outflow is the only low-mass protostellar outflow that has extensively been studied in this regard.
Aims. We mapped COM emission and derived the molecular composition of the protostellar outflow driven by the Class 0 protostar NGC 1333 IRAS 4B1 to introduce it as a new laboratory for studying the effect of shocks on COM chemistry.
Methods. We used the data taken as part of the PROtostars & DIsks: Global Evolution (PRODIGE) large program to compute integrated-intensity maps of outflow emission to identify spatial differences between species. The emission spectra were then analysed towards two positions, one in each outflow lobe, by deriving synthetic spectra and population diagrams assuming conditions of local thermodynamic equilibrium.
Results. In addition to typical outflow tracers such as SiO and CO, outflow emission is seen from H2CO, HNCO, and HC3N, as well as from the COMs CH3OH, CH3CN, and CH3CHO, and even from deuterated species such as DCN, D2CO, and CH2DOH. The maps of integrated-intensity ratios between CH3OH and DCN, D2CO, and CH3CHO reveal gradients with distance from the protostar. For DCN and D2CO, this may reflect their pre-stellar abundance profile, provided the outflow is young enough, while an explanation is still required for CH3CHO. Intensity ratio maps of HC3N and CH3CN with respect to CH3OH peak in the southern lobe where the temperatures are highest. This might indicate enhanced HC3N and CH3CN formation at this location, potentially in the warmer gas phase. Rotational temperatures are found in the range ∼50-100K, which is warmer on average than for the L1157-B1 shock spot (≲ 30K). The abundances with respect to CH3OH are higher by factors of a few than for L1157-B1.
Conclusions. For the first time, we securely detected the COMs CH3CN, CH3CHO, and CH2DOH in the IRAS 4B1 outflow, serendipitously with a limited sensitivity and bandwidth. Targeted observations will enable the discovery of new COMs and a more detailed analysis of their emission. The morphological differences between the molecules in the IRAS 4B1 outflow lobes and their relative abundances provide first proof that this outflow is a promising new laboratory for shock chemistry, which will offer crucial information on COM formation and destruction as well as on outflow structure and kinematics.

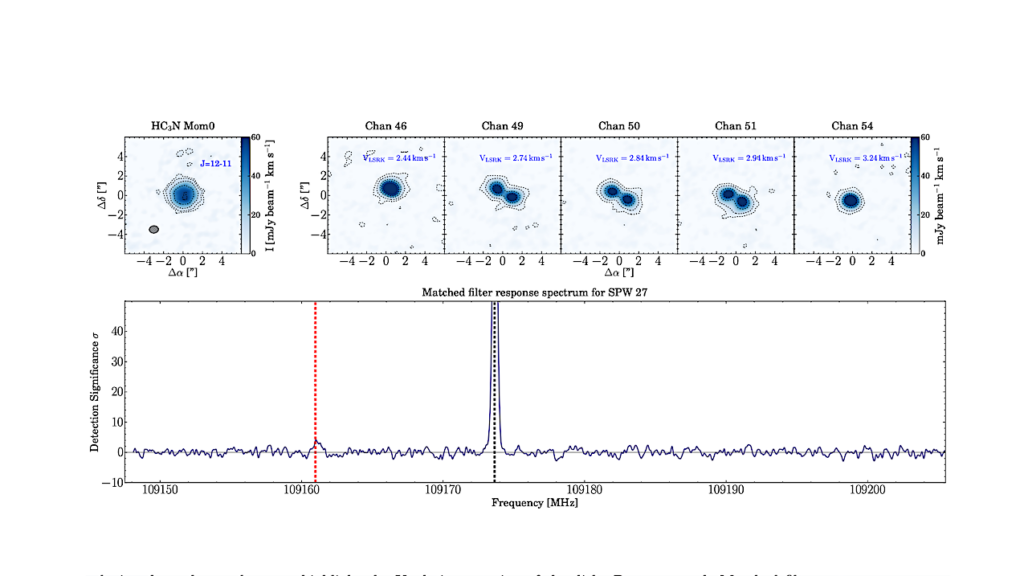
Integrated intensity maps towards IRAS 4B1 (yellow star) for SiO 2 – 1 (Eu = 31 K; colour) and CH3OH 42 − 31 and DCN 3 – 2 (Eu = 45 K and 21 K, respectively; contours). The SiO maps are integrated from −25 to 6 km s−1 and 6.8 to 47 km s−1 and show emission above 10σ with σblue = 0.42 K km s−1 and σred = 0.49 K km s−1 . Contours are at −30σ,−15σ, 15σ, 30σ, and then increase by a factor of 3 for CH3OH (σblue = 0.25 K km s−1 and σred = 0.23 K km s−1 ) and at −10σ, −5σ, 5σ, 10σ, and then increase by a factor of 3 for DCN (σblue = 0.17 K km s−1 and σred = 0.24 K km s−1 ). Velocity ranges (in km s−1 ) used for the integration of CH3OH and DCN emission are indicated in the top left. The HPBW is shown in the bottom left. Positions R1 and B1 were selected for further spectral-line analysis (Sect. 3.3). Black crosses indicate H2 knots (Choi & Lee 2011). — Astronomy & Astrophysics
- PRODIGE – Envelope to disk with NOEMA VII. (Complex) organic molecules in the NGC1333 IRAS 4B1 outflow: A new laboratory for shock chemistry, Astronomy & Astrophysics (open access)
- PRODIGE – envelope to disk with NOEMA: VII. (Complex) organic molecules in the NGC1333 IRAS4B1 outflow: A new laboratory for shock chemistry, Astronomy & Astrophysics via Arxiv.org (open access)
Astrobiology, Astrochemistry