Technosignature Searches With Real-time Alert Brokers
We present an exploration of technosignature research that is possible using real-time alert brokers from surveys such as the Zwicky Transient Facility (ZTF) and the upcoming Legacy Survey of Space and Time (LSST).
Nine alert brokers currently stream up to 1 million alerts each night from ZTF, and LSST is projected to increase this volume by an order of magnitude. While these brokers are primarily designed to facilitate real-time follow-up of explosive transients such as supernovae, they offer a unique platform to discover rare forms of variability from nearby stars in real time, which is crucial for follow-up and characterization.
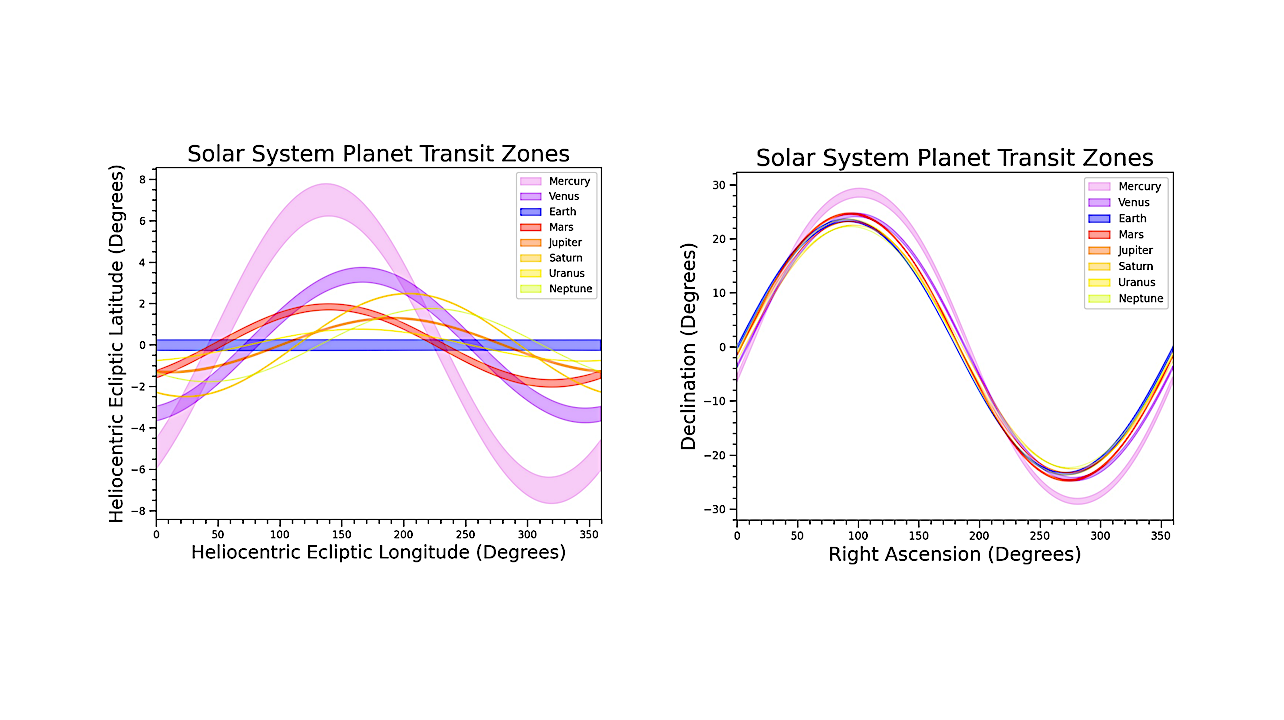
We evaluate the capability for both spatial and temporal searches for extraterrestrial intelligence (SETI) methods using the currently available brokers, and present examples of technosignature searches using ZTF alert and archival data. We have deployed optical SETI techniques, such as planetary transit zone geometries and the SETI Ellipsoid.
We have also developed a search for novel high-amplitude stellar dippers, and present a workflow that integrates features available directly through the brokers, as well as post-processing steps that build on the existing capabilities.
Though the SETI methods that alert brokers can execute are currently limited, we provide suggestions that may enhance future technosignature and anomaly searches in the era of the Vera C. Rubin Observatory.
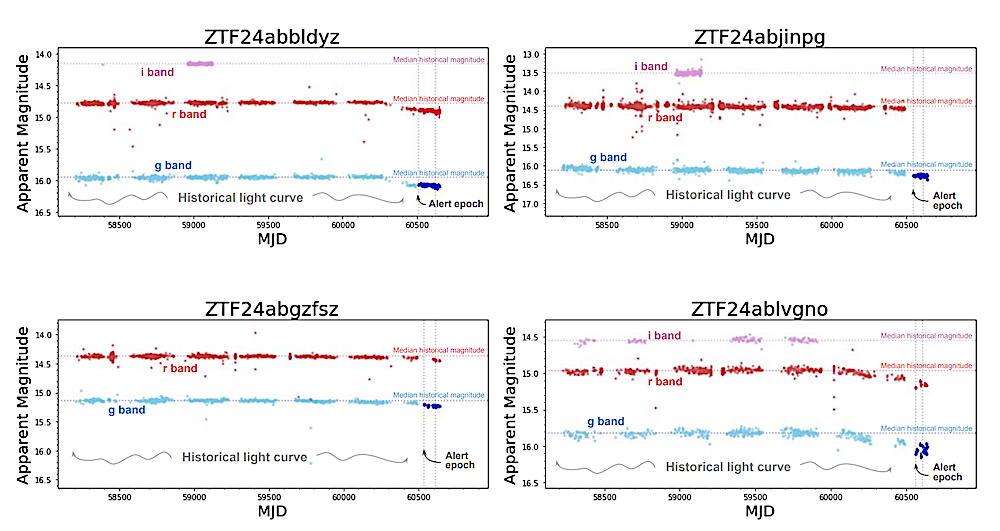
Light curves are plotted for all four objects that passed both sets of filters within and beyond the brokers on the night of 2024 November 24. Left to right and top to bottom, we have ZTF24abbldyz, ZTF24abjinpg, ZTF24abgzfsz, and ZTF24ablvgno. Figure 7 shows these objects plotted on a colormagnitude diagram as points A, B, C, and D, respectively. As in Figure 4, the data plotted is an amalgamation of historical data pulled from the ZTF archive and alert packet data pulled with the Lasair API query. I-band, R-band, and G-band data are shown in purple, red, and blue, respectively. Note that I-band data is the least represented of the three bands, thus we primarily use R-band and G-band data to draw conclusions about the objects’ behavior. All other plot features are the same as in Figure 4. It can be observed in all four light curves that the alert packet data is fainter than the historical data, indicating a dip in brightness. ZTF24abbldyz shows a gradual dip in brightness beginning well before the alert epoch (≈ 250 days earlier) and continuing until the most recent data. Despite having noisier data, ZTF24ablvgno shows a clear dip in brightness beginning roughly 500 days before the alert epoch. — astro-ph.IM
Eleanor M. Gallay, James R. A. Davenport, Steve Croft
Subjects: Instrumentation and Methods for Astrophysics (astro-ph.IM); Solar and Stellar Astrophysics (astro-ph.SR)
Cite as: arXiv:2506.14744 [astro-ph.IM] (or arXiv:2506.14744v1 [astro-ph.IM] for this version)
https://doi.org/10.48550/arXiv.2506.14744
Focus to learn more
Related DOI:
https://doi.org/10.3847/1538-3881/ade4bb
Focus to learn more
Submission history
From: Eleanor Gallay
[v1] Tue, 17 Jun 2025 17:29:23 UTC (2,244 KB)
https://arxiv.org/abs/2506.14744
Astrobiology, SETI,