Ocean Planet Biodiversity Genomics

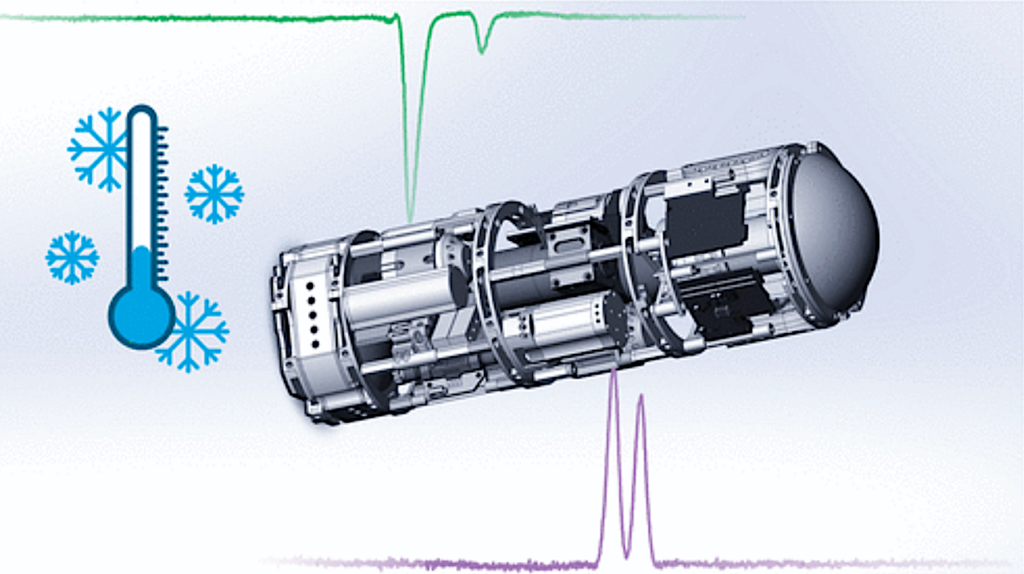
The deep sea, covering approximately 65% of Earth’s surface, has long been considered a biological desert. In this extreme environment—particularly in the hadal zone at depths greater than 6,000 meters—organisms endure immense pressures exceeding one ton per square centimeter, near-freezing temperatures, low oxygen levels, and constant darkness.
With the rapid advancement of China’s deep-sea exploration technology, however, researchers have discovered that the hadal zone is not a barren abyss but a cradle of evolutionary marvels. Creatures such as the hadal snailfish not only survive in this extreme environment but have also formed unique ecosystems.
Graphical Abstract — CELL
In a study published in Cell, Prof. HE Shunping’s team from the Institute of Hydrobiology (IHB) of the Chinese Academy of Sciences (CAS), along with researchers from the Institute of Deep-Sea Science and Engineering of CAS, Northwestern Polytechnical University, and BGI-Qingdao, have unveiled the evolutionary history and genetic mechanisms that enable deep-sea fish to survive in Earth’s most extreme conditions, shedding new light on how life endures in such environments.
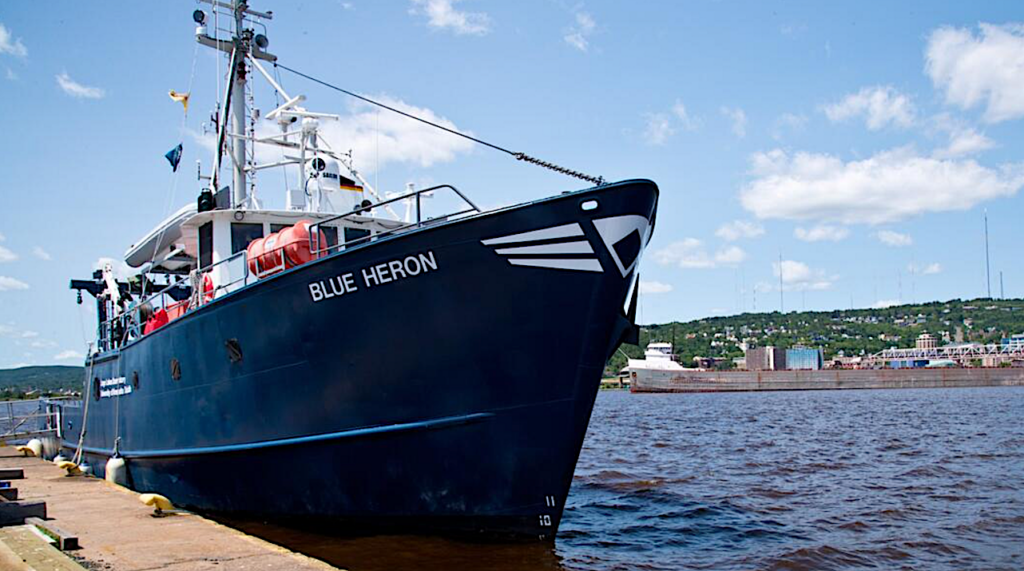
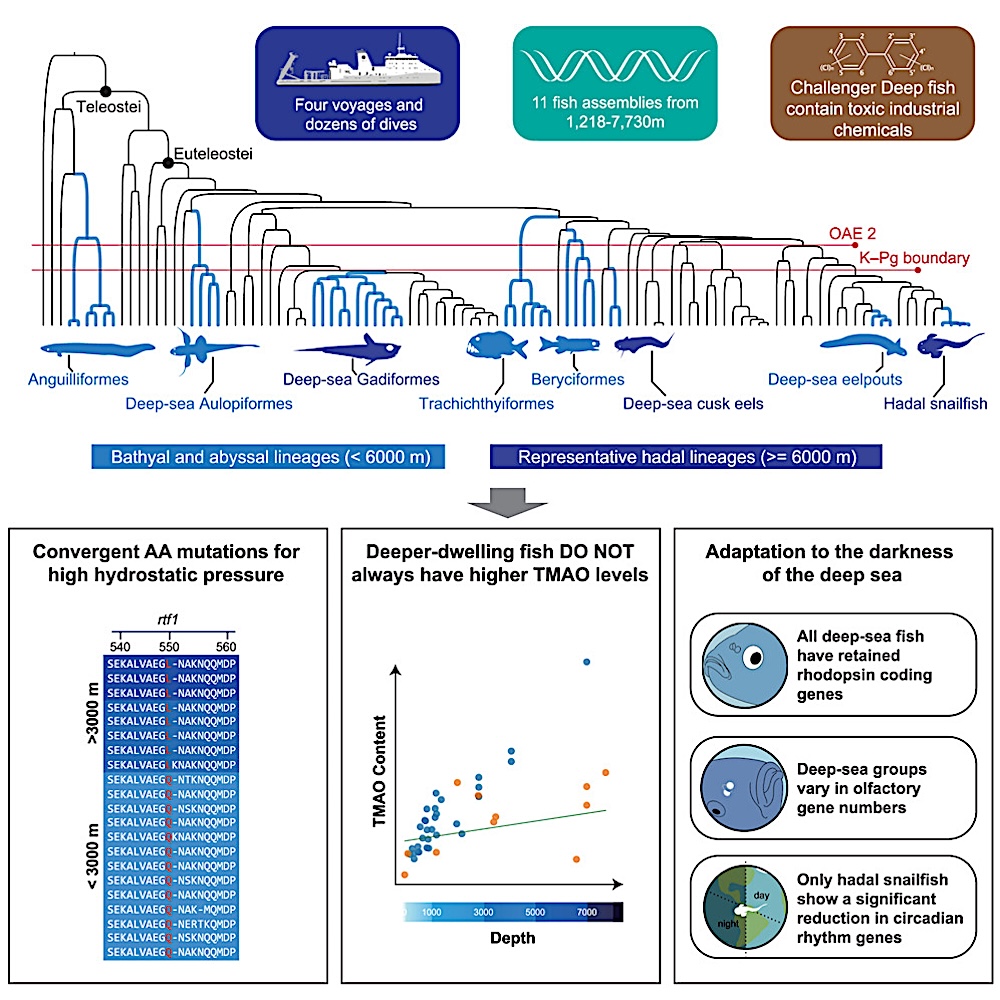
This study was based on extensive sampling conducted by the motherships Tansuo Yihao (Exploration I) and Tansuo Erhao (Exploration II), which are equipped with the manned submersibles Shenhai Yongshi (Deep-Sea Warrior) and Fendouzhe (Striver), respectively.
The sampling spanned from the western Pacific to the central Indian Ocean, covering diverse geological features such as trenches, basins, fracture zones, and hydrothermal vents. It encompassed nearly the entire depth range of deep-sea fish habitats (1,218–7,730 meters) and yielded 11 deep-sea fish species from six major groups.
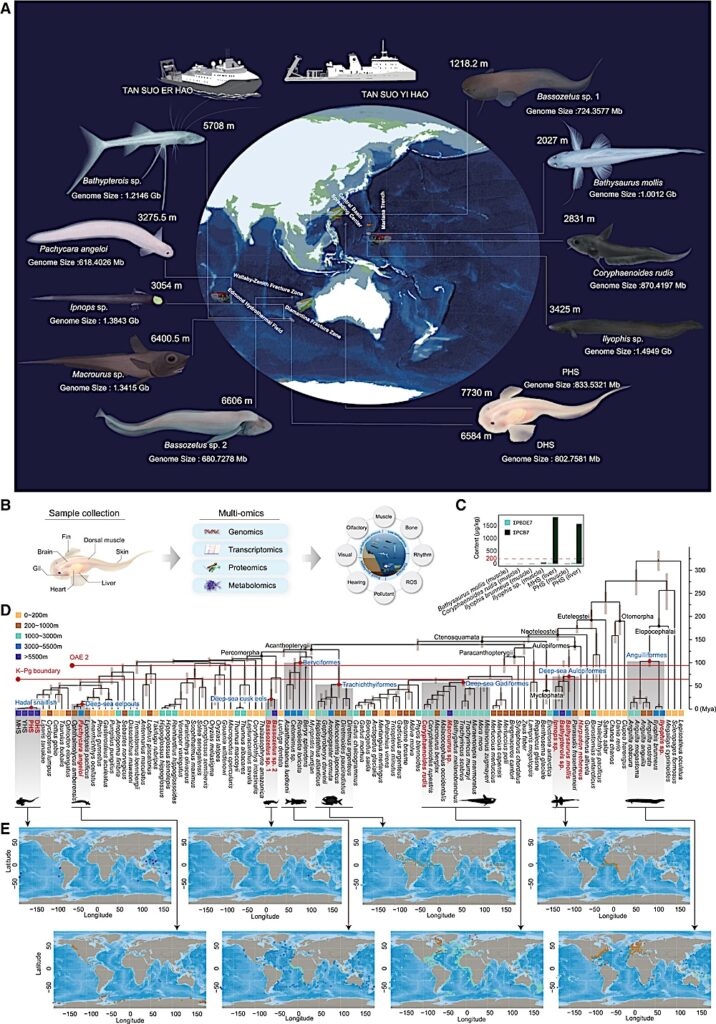
Geographical distribution and historical colonization patterns of 11 deep-sea species
(A) Sampling information and morphological characteristics of 11 deep-sea species. These samples were captured from depths ranging between 1,218 and 7,730 m, spanning locations from the Mariana Trench to the Middle Indian Ocean by the manned submersible “Shenhai Yongshi (Deep-Sea Warrior)” and the manned submersible “Fendouzhe (Striver)” as well as the remotely operated vehicle (ROV) “TIAN YA (Skyline)” during our expeditions aboard the mothership TAN SUO YI HAO (exploration I) and TAN SUO ER HAO (exploration II).
(B) Flowchart for studying the process, pattern, and mechanism of deep-sea adaptation by multi-omics strategy. Fish sample tissue and experimental method schematic for research, multi-omics joint analysis, and deep-sea environmental factors, and adaptation characteristics of deep-sea fish.
(C) The concentrations of persistent organic pollutants (POPs) in the muscle or liver tissues of several deep-sea fish and the hadal snailfish (μg/kg wet weight). ΣPCB7 (dark green bar chart) represents the sum of seven PCB congeners with a wide range of chlorination (28, 52, 101, 118, 138, 153, and 180), and ΣPBDE7 (light green bar chart) represents the sum of seven PBDE congeners chosen for their frequent occurrence in the environment (28, 47, 99, 100, 153, 154, and 183). The vertical axis lists the names of the detected fish species and the selected tissue types. The red baseline represents the National Food Safety Standards of China (GB2762-2022) for PCBs in aquatic animal fats.
(D) Phylogenetic topology and divergence times of 107 major fish taxa. The different habitat depth ranges of these taxa are indicated using five colors: orange, brown, green, blue, and purple. Red Latin names denote the new deep-sea fish samples sequenced in this study. The fish taxa, including those found at depths of 3,000 m or more, are categorized into eight major deep-sea lineages (highlighted with a gray background). The classification names of these major fish lineages are labeled in blue and black fonts, indicating their respective orders or clades. Red lines mark two significant historical marine mass extinction events: the most recent Cretaceous global oceanic anoxic events (OAE2, 94–96 Ma) and the Cretaceous-Paleogene extinction event (K-PG extinction event, ∼66 Ma).
(E) Global distribution ranges of fish species from 8 faunal groups (data derived from the RGBIF database and collection locations of deep-sea fish in this study). Different color points indicate fish groups from different depth ranges. Several groups of fish that anciently migrated into the deep sea exhibit a near-global distribution pattern.
By analyzing genetic data from these deep-sea fish, the researchers reconstructed their evolutionary history, revealing how vertebrates conquered the deep sea through distinct processes and mechanisms, thereby reshaping our understanding of deep-sea adaptation.
Through this process, the researchers confirmed a century-old hypothesis about deep-sea fish evolution involving two distinct pathways. “Ancient survivors” represent lineages that colonized the deep sea before the Cretaceous mass extinction, while “new immigrants” account for the majority of modern deep-sea species that emerged after the mass extinction 60 million years ago. This dual-pathway model offers insights into how vertebrates adapted to the deep sea through distinct evolutionary processes.
One finding of this study challenged the traditional trimethylamine N-oxide (TMAO) hypothesis of deep-sea adaptation. While TMAO levels increase with depth in fish living between 0 and 6,000 meters below sea level, this trend does not extend beyond 6,000 meters. The researchers identified a highly conserved convergent mutation in the rtf1 gene across all deep-sea fish living at depths greater than 3,000 meters and found that this mutation enhances transcription efficiency, representing a newly discovered genetic mechanism for pressure adaptation.
Furthermore, the researchers detected high concentrations of polychlorinated biphenyls (PCBs) in liver tissues of hadal snailfish from the Mariana Trench and the Philippine Sea Basin. These synthetic pollutants have infiltrated the planet’s deepest trenches, reflecting the pervasive impact of human activity and raising concern about deep-sea environmental conservation.
Conducted under the Global Deep-Sea Trenches Exploration Program (Global TREnD), this study represents a comprehensive investigation of deep-sea fish adaptation, spanning genetic to ecological levels. It not only uncovers key mechanisms that enable life to thrive in extreme environments but also establishes a new interdisciplinary paradigm for studying deep-sea adaptation, paving the way for future research in biology, ecology, and deep-sea conservation.
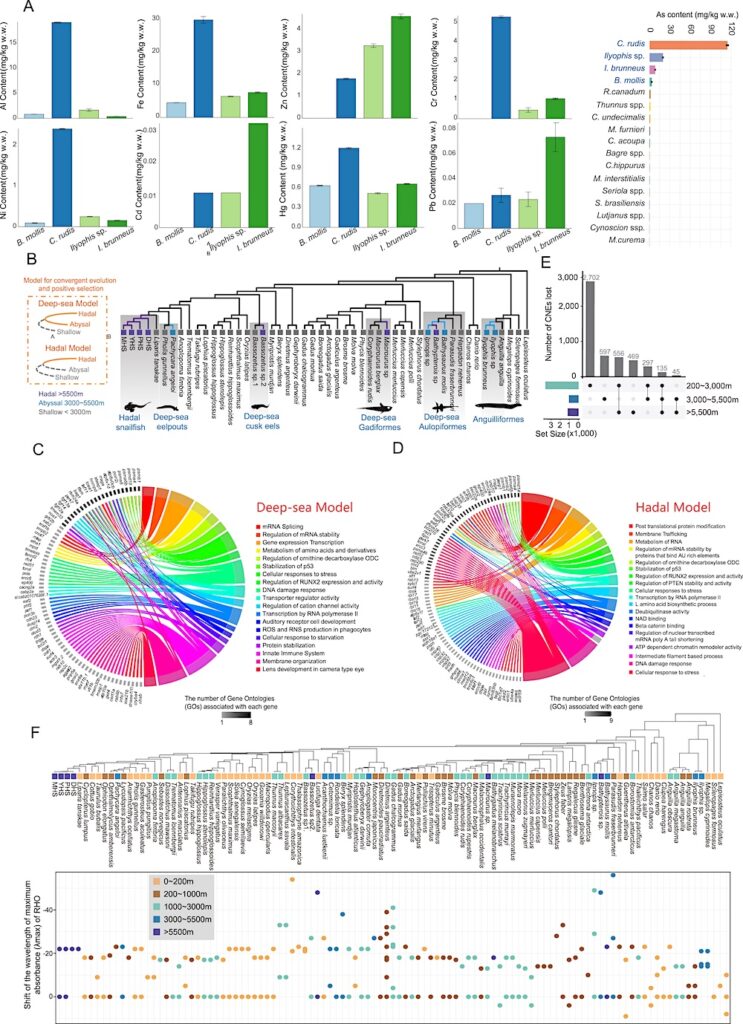
(A) The contents of different mineral elements in four species: Bathysaurus mollis, Coryphaenoides rudis, Ilyophis sp., and Ilyophis brunneus. The far-right panel shows the differences in As (arsenic) content in muscle tissue between deep-sea and shallow-water fish. Coryphaenoides rudis exhibit extremely high accumulation of As content.
(B) The phylogeny topology of 50 representative fish. The gray background represents deep-sea fish and their shallow-water species. Purple branch: hadal (>5,500 m); blue branch: abyssal (3,000–5,500 m); gray branch: shallow (<3,000 m).
(C) GO term and KEGG enrichment of convergent evolution and positive selection in deep-sea model.
(D) GO term and KEGG enrichment of convergent evolution and positive selection in hadal model.
(E) Upset plot showing the number of lost CNEs in different groups.
(F) By comparing the RH1 protein sequences of 107 fish species with that of bovine RH1, we inferred the wavelength shift of maximum absorbance for RH1 genes. Values less than 0 indicate a blue shift, while values greater than 0 indicate a red shift. Notably, Benthosema glaciale, Stylephorus chordatus, Diretmoides pauciradiatus, and Diretmus argenteus exhibited only partial gene changes.
Evolution and genetic adaptation of fishes to the deep sea, Cell
Astrobiology, Biodivesity, oceanography,