X-Raying Neutral Density Disturbances in the Mesosphere and Lower Thermosphere induced by the 2022 Hunga-Tonga Volcano Eruption-Explosion
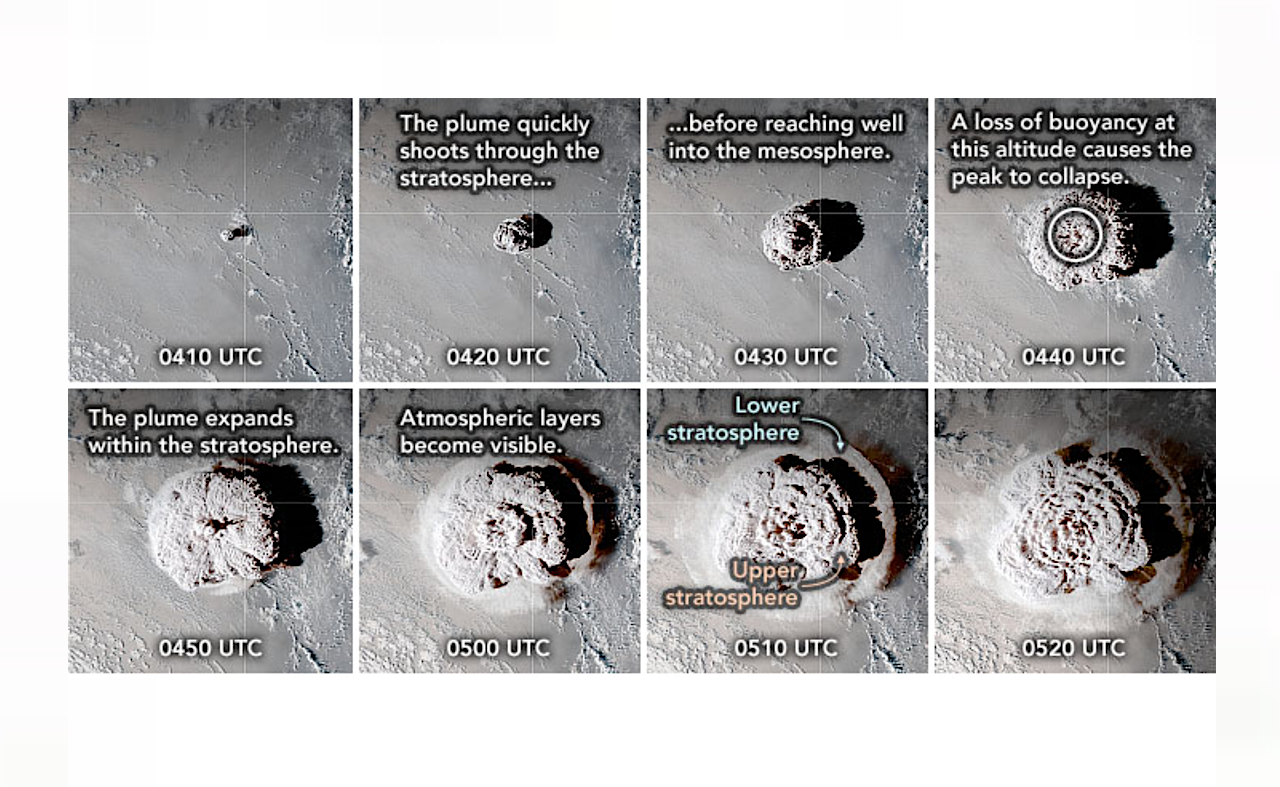
We present X-ray observations of the upper atmospheric density disturbance caused by the explosive eruption of the Hunga Tonga-Hunga Ha’apai (HTHH) volcano on 15 January 2022.
From 14 January to 16 January, the Chinese X-ray astronomy satellite, Insight-HXMT, was observing the supernova remnant Cassiopeia A. The X-ray data obtained during Earth’s atmospheric occultations allowed us to measure neutral densities in the altitude range of ~90-150 km.
The density profiles above 110 km altitude obtained before the major eruption are in reasonable agreement with expectations by both GAIA and NRLMSIS 2.0 models. In contrast, after the HTHH eruption, a severe density depletion was found up to ~1,000 km away from the epicenter, and a relatively weak depletion extending up to ~7,000 km for over 8 hr after the eruption.
In addition, density profiles showed wavy structures with a typical length scale of either ~20 km (vertical) or ~1,000 km (horizontal). This may be caused by Lamb waves or gravity waves triggered by the volcanic eruption.

Upper panel: Tangent point altitudes during the atmospheric occultations analyzed in this paper, overlaid on the Earth’s surface map. The thin and thick lines are responsible for January 14 and 15 in 2022, respectively. The HTHH location is marked as a red triangle. The iso-distance circles from the eruption epicenter are shown in black dashed lines (unit: km). Lower panel: Density ratios of our observations to the GAIA model. Occultation IDs 1+2, 3+4+5, and 6+7, and 8+9 are combined together to improve the photon statistics. — astro-ph.EP
Satoru Katsuda, Hiroyuki Shinagawa, Hitoshi Fujiwara, Hidekatsu Jin, Yasunobu Miyoshi, Yoshizumi Miyoshi, Yuko Motizuki, Motoki Nakajima, Kazuhiro Nakazawa, Kumiko K. Nobukawa, Yuichi Otsuka, Atsushi Shinbori, Takuya Sori, Chihiro Tao, Makoto S. Tashiro, Yuuki Wada, Takaya Yamawaki
Comments: 14 pages, 4 figures, accepted for publication in Geophysical Research Letters
Subjects: Geophysics (physics.geo-ph); Earth and Planetary Astrophysics (astro-ph.EP); Atmospheric and Oceanic Physics (physics.ao-ph)
Cite as: arXiv:2410.09410 [physics.geo-ph] (or arXiv:2410.09410v1 [physics.geo-ph] for this version)
https://doi.org/10.48550/arXiv.2410.09410
Focus to learn more
Submission history
From: Satoru Katsuda Dr.
[v1] Sat, 12 Oct 2024 07:34:18 UTC (673 KB)
https://arxiv.org/abs/2410.09410
Astrobiology,


