Tricorder Tech: Astrobiological Applications Of μ-mapping X-ray Fluorescence Spectrometry
Many low-temperature planetary surface processes leave traces of their actions as features in the size range from 0.01 mm to several mm. Syn-sedimentary, authigenic and diagenetic features at the higher end of this size range include varves, vesicles, precipitates and concretions that can be used to decipher depositional and diagenetic processes.
On the Earth, microbial life is known to exploit microscale disequilibria at boundaries where valence, chemical potential, pH, Eh, etc., vary on a length scale commensurate with the organisms themselves – tens to thousands of micrometres. These disequilibria can exist within cracks or veins in rocks and ice, at inter- or intra-crystalline boundaries, at sediment/water or sediment/atmosphere interfaces, or within fluid inclusions trapped inside minerals.
Larger organized sedimentary structures such as stromatolites can provide macroscale evidence of biogenic influence, but abiotic examples are known as well and detailed study at the microscale is required for confirmation of biogenicity. Detection of accumulations of the biogenic elements C, N, O, P and S at appropriate concentrations on or in a mineral substrate could constitute permissive evidence of life, but context is also necessary.
Does or did the putative biosignature exist in a habitable environment? Under what conditions of P, T and chemical potential was the host mineralogy formed? Most importantly, post-emplacement alteration (taphonomy) resulting from variations in temperature, pressure or fluid chemistry after deposition has the capacity to preserve evidence of biogenicity or its processes, or to erase such evidence completely.
In the characterization of solids (rocks, soil or planetary regolith), three fundamental properties can be used to elucidate conditions of formation and post-formational processing history: crystal structure, elemental composition and morphology. Based on these measurable properties, it is possible to determine provenance (useful in evaluating habitability or biogenicity) and taphonomy (useful in evaluating preservation potential).
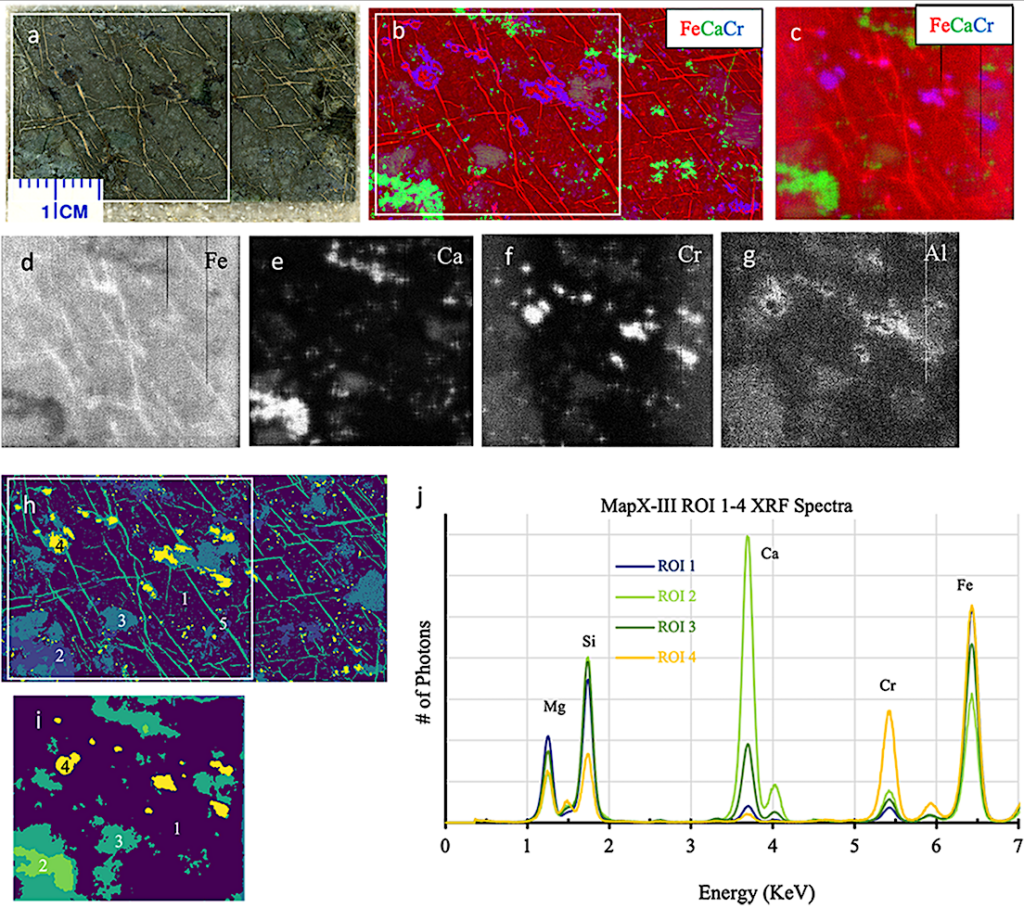
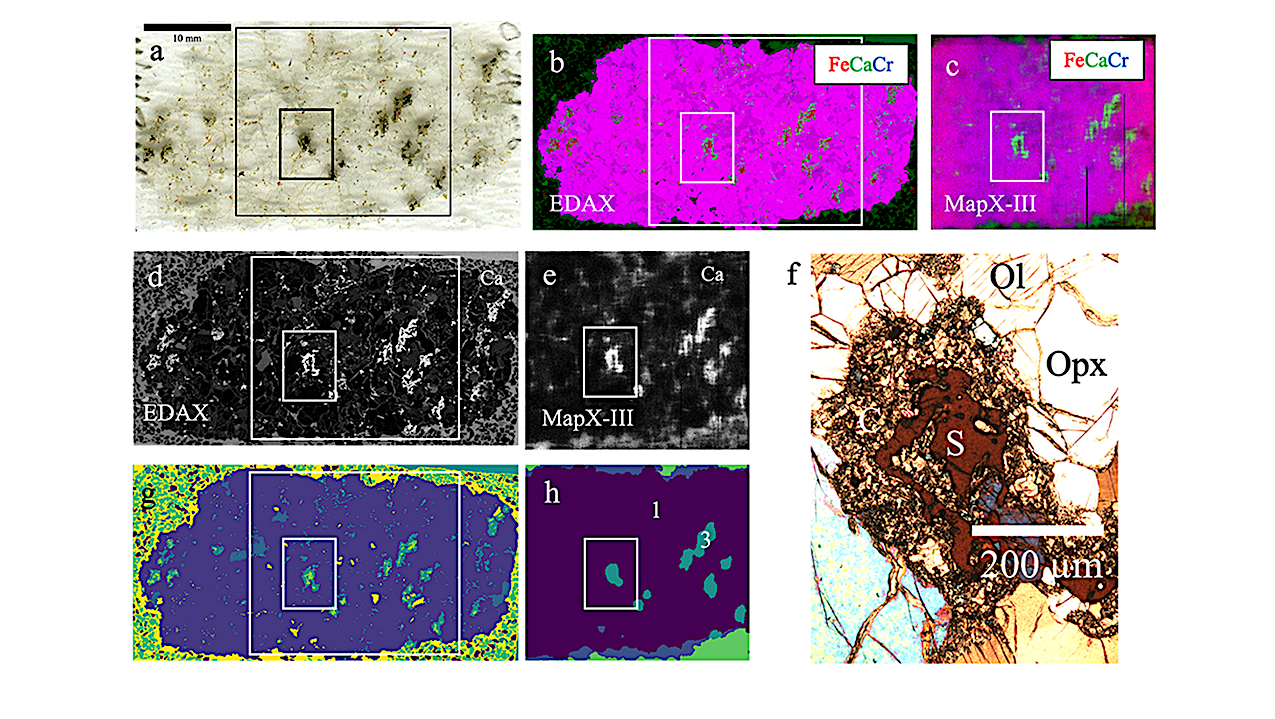
Thin section stub of a partially serpentinized cobble from Complexion Springs, California. (a) Optical image, white rectangle shows area imaged in MapX-III; (b) RGB element map from EDAX-Orbis instrument (50 μm resolution), Red = Fe, Green = Ca, Blue = Cr, white rectangle shows area imaged in MapX-III; (c) RGB element map from MapX-III (~125 μm resolution), same colour scheme as in b; (d–g) element images from MapX-III; (h) ROI selected by elemental correlation cluster analysis from EDAX hdf5 data cube (numbers refer to individual ROI also shown in (i) from the MapX-III instrument; (i) ROI selected by elemental correlation cluster analysis from MapX-III hdf5 data cube; (j) MapX-III XRF spectra from individual ROI, numbers refer to ROI labelled in (i) (total MapX-III beam power = 2.25 Wh (30 min analysis)). — International Journal of Astrobiology
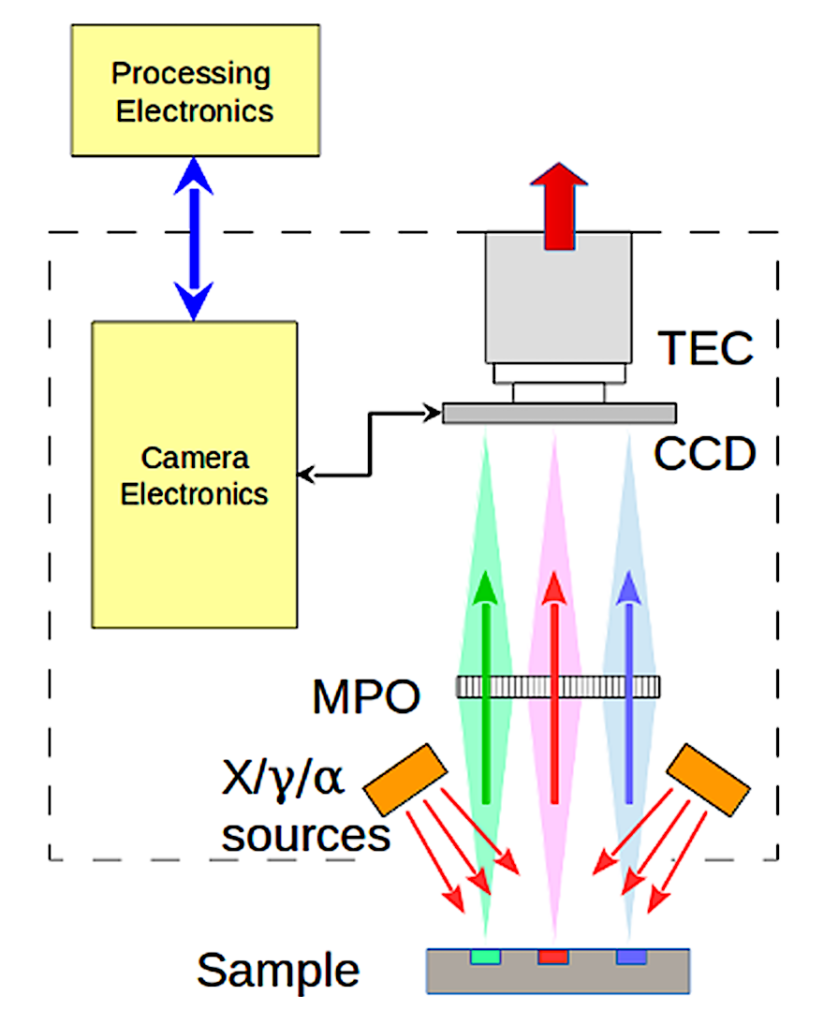
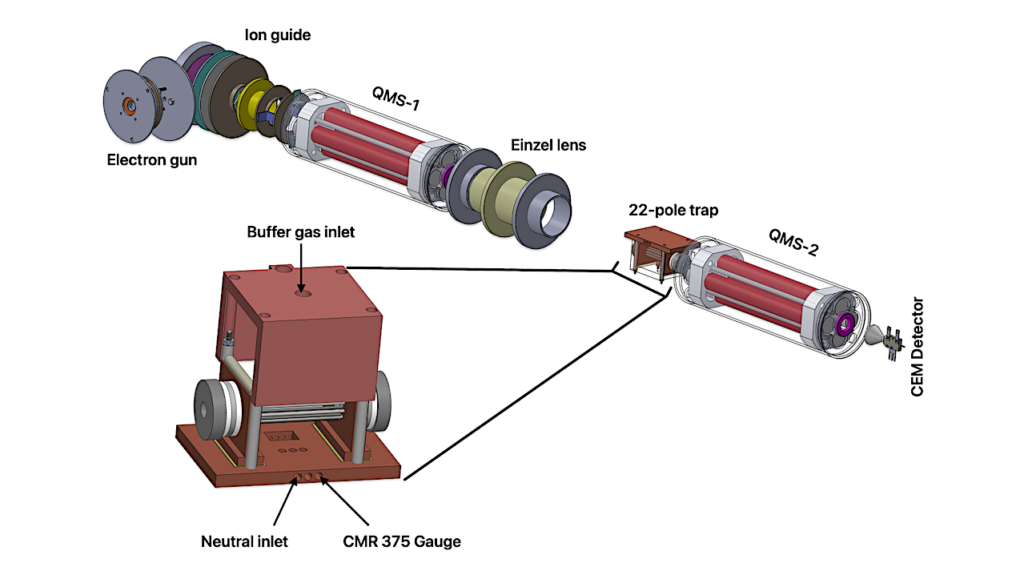
Schematic diagram of the MapX instrument. X-ray or radioisotope sources fluoresce the sample. Fluoresced X-ray photons characteristic of elements present in the sample are emitted over 2π steradians from their point of origin on the surface. Photons that enter the MPO within its acceptance angle are focused onto an energy-discriminating X-ray sensitive CCD in a 1:1 configuration with the sample. Hundreds to thousands of short exposures, each one a complete 2D X-ray image of the sample, are summed to produce an hdf5 data file. — International Journal of Astrobiology
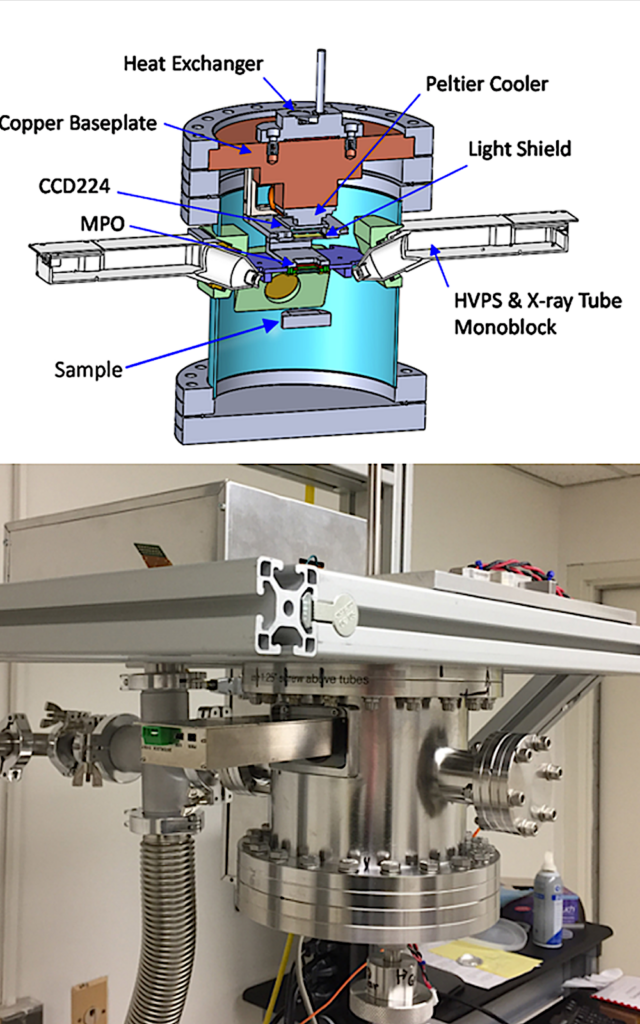
Cross-section of MapX-III prototype, showing sample position, X-ray tubes, MPO and CCD224 imager in an evacuated chamber. (b). MapX-III prototype. With the exception of the X-ray tubes, MapX-III is assembled from flight qualified or qualifiable components: two Newton Scientific M54 Au target transmission X-ray tubes; an e2v front illuminated, deep depleted frame transfer CCD-224 (legacy from CheMin, 600 × 600 40 μm pixels); and an Ir coated 1.5 mm thick MPO with 20 μm square channels and 6 μm thick walls. Samples in MapX-III are held in the same vacuum as the CCD, eliminating the need for a Be window and allowing for element detection down to Z = 11 (Na). MapX-III has a lateral spatial resolution of ~125 μm and an energy resolution of ~200 eV. — International Journal of Astrobiology
Astrobiological applications of μ-mapping X-ray fluorescence spectrometry
Astrobiological applications of μ-mapping X-ray fluorescence spectrometry, International Journal of Astrobiology (open access)
Astrobiology,