Source Of Radio Emissions Induced By The Galilean Moons Io, Europa and Ganymede: in situ Measurements By Juno
At Jupiter, part of the auroral radio emissions are induced by the Galilean moons Io, Europa and Ganymede. Until now, except for Ganymede, they have been only remotely detected, using ground-based radio-telescopes or electric antennas aboard spacecraft.
The polar trajectory of the Juno orbiter allows the spacecraft to cross the range of magnetic flux tubes which sustain the various Jupiter-satellite interactions, and in turn to sample in situ the associated radio emission regions.
In this study, we focus on the detection and the characterization of radio sources associated with Io, Europa and Ganymede. Using electric wave measurements or radio observations (Juno/Waves), in situ electron measurements (Juno/JADE-E), and magnetic field measurements (Juno/MAG) we demonstrate that the Cyclotron Maser Instability (CMI) driven by a loss-cone electron distribution function is responsible for the encountered radio sources.
We confirmed that radio emissions are associated with Main (MAW) or Reflected Alfvén Wing (RAW), but also show that for Europa and Ganymede, induced radio emissions are associated with Transhemispheric Electron Beam (TEB). For each traversed radio source, we determine the latitudinal extension, the CMI-resonant electron energy, and the bandwidth of the emission. We show that the presence of Alfvén perturbations and downward field aligned currents are necessary for the radio emissions to be amplified.
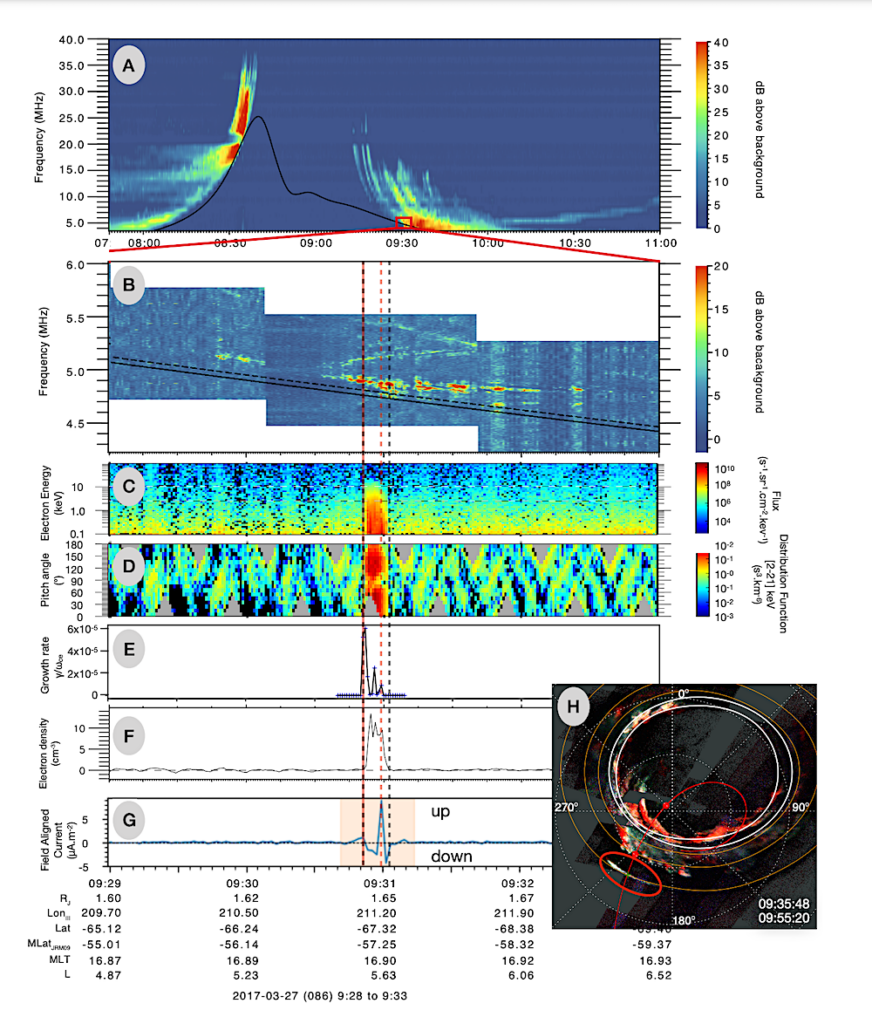
Figure 1: Juno data during Perijove 5, on 27 March 2017. Panels (A,B) display Juno/Waves data (A) in low–resolution mode and (B) in high–resolution mode. The solid–black lines represent the electron cyclotron frequency derived from the magnetic field measurements of Juno/MAG, and the dashed–black line is 1.01 × fce. Panels (C–D) display Juno/JADE–E measurements: (C) the electron differential number flux (or intensity) of all electrons; (D) the electron distribution function for energy in range [2–21] keV as a function of pitch angles; Panels (E) displays the normalized growth rate γ/ωce maximal value calculated using Equation 6. Panel (F) shows the partial electron density calculated from the JADE–E flux. Panel (G) shows the field aligned currents calculated based on Al Saati et al. (2022)’s method, using magnetic field fluctuations in the azimuthal direction (δBϕ) deduced from the Juno/MAG measurements. The vertical dashed black lines represent the flux tube crossing as inferred from JADE data, while vertical dashed red lines represent the time interval where positive growth rate are calculated from JADE–E measurements. Panel (H) displays a UV map of the southern hemisphere, using Juno/UVS measurements from 09:35:49 to 09:55:20. The red line indicates Juno’s trajectory, with the red dots its position at the start and end time of the measurements used for this image. Io UV footprint is highlighted by the red ellipse. — astro-ph.EP
C. K. Louis, P. Louarn, B. Collet, N. Clément, S. Al Saati, J. R. Szalay, V. Hue, L. Lamy, S. Kotsiaros, W. S. Kurth, C. M. Jackman, Y. Wang, M. Blanc, F. Allegrini, J. E. P. Connerney, D. Gershman
Subjects: Earth and Planetary Astrophysics (astro-ph.EP); Space Physics (physics.space-ph)
Cite as: arXiv:2308.05541 [astro-ph.EP] (or arXiv:2308.05541v1 [astro-ph.EP] for this version)
Submission history
From: Corentin Louis
[v1] Thu, 10 Aug 2023 12:40:29 UTC (9,079 KB)
https://arxiv.org/abs/2308.05541
Astrobiology