An Evolutionary Timescale For Bacteria Calibrated Using The Great Oxidation Event
Most of life’s diversity and history is microbial but it has left a meagre fossil record, greatly hindering understanding of evolution in deep time.
However, the co-evolution of life and the Earth system has left signatures of bacterial metabolism in the geochemical record, most conspicuously the Great Oxidation Event (GOE) ∼2.33 billion years ago (Ga, (Poulton et al. 2021)), in which oxygenic photosynthesis and tectonism (Eguchi, Seales, and Dasgupta 2019) transformed Earth’s biosphere from dominantly anaerobic to aerobic. Here, we combine machine learning and phylogenetic reconciliation to infer ancestral transitions to aerobic lifestyles during bacterial evolution.
Linking these transitions to the GOE provides new constraints to infer the timetree of Bacteria. We find that extant bacterial phyla are truly ancient, having radiated in the Archaean and the Proterozoic: the oldest include Bacillota (Firmicutes), which radiated 3.1-3.7 Ga, Cyanobacteria (3.3-3.5 Ga) and Patescibacteria (3-3.5 Ga). We show that most bacterial phyla were ancestrally anaerobic and that most transitions to an aerobic lifestyle post-dated the GOE.
Our analyses trace oxygen production and consumption back to Cyanobacteria. From that starting point, horizontal transfer seeded aerobic lifestyles across bacterial diversity over hundreds of millions of years. Our analyses demonstrate that the diversification of aerobes proceeded in two waves corresponding to the GOE and to a second sustained rise in atmospheric O2 at the dawn of the Palezoic (Krause et al. 2022).
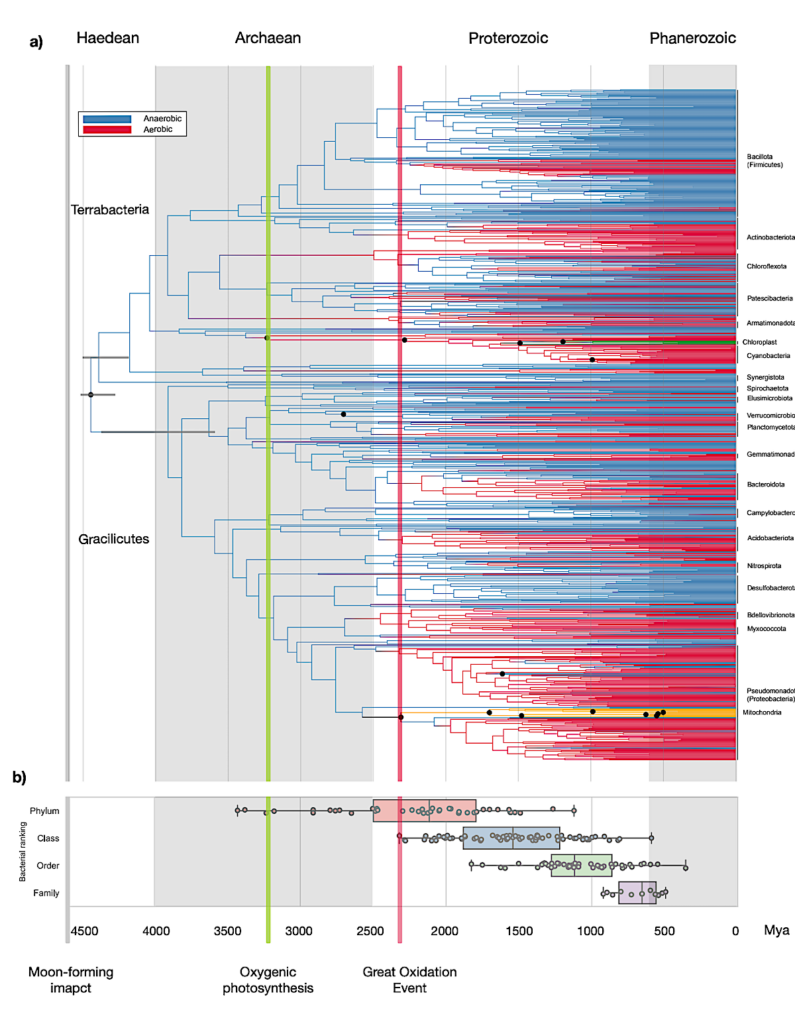
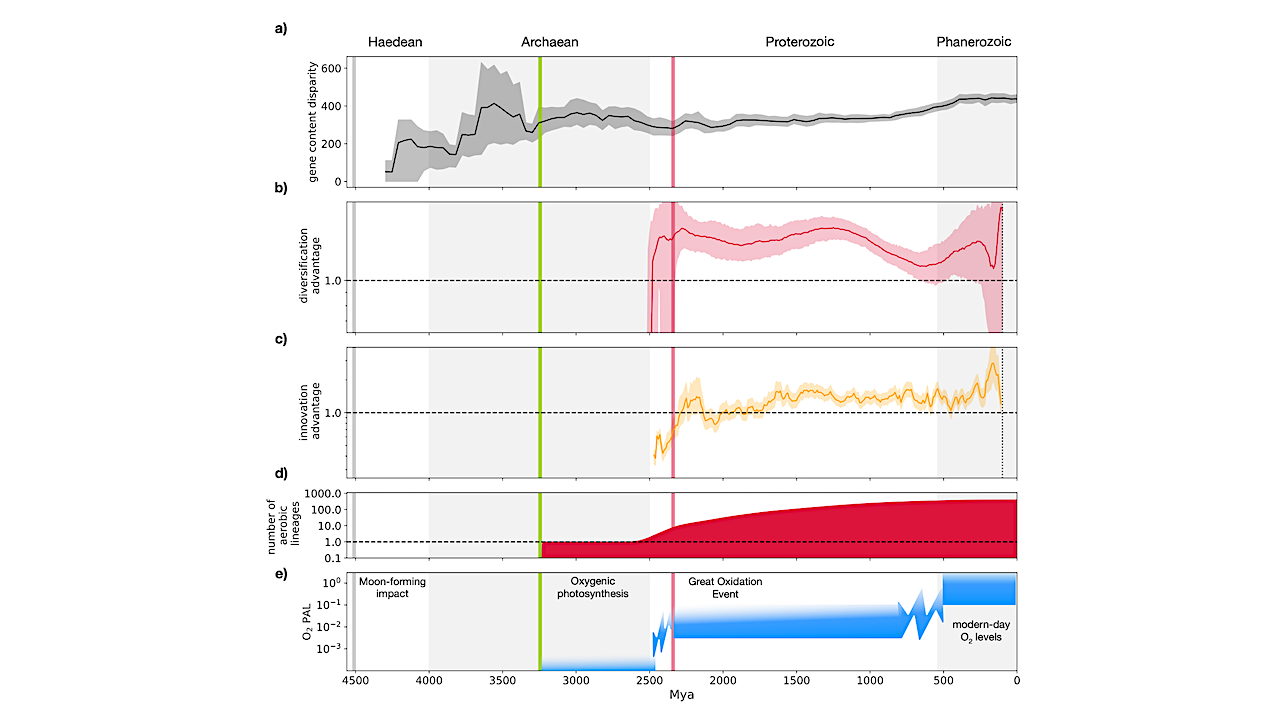
A dated phylogeny of Bacteria. a) dated phylogenetic tree of Bacteria. Branch colours represent anaerobic (blue) and aerobic lineages (red). Mitochondrial branches are colored in orange while chloroplast branches are coloured in green. Branch lengths are proportional to geological time (Ga). 95% highest posterior densities are shown for the root, and the two major bacterial divisions Gracilicutes and Terrabacteria. The grey line shows the Moon-forming impact at ~4.52 Ga; the green line at ~3.23 Ga reflects the presence of fossil and isotopic evidence for oxygenic photosynthesis; the red line at ~2.33 Ga reflects the end of the GOE (see calibrations in Supplementary Material). The bottom panel shows the ages of taxonomic groups. The names of phyla represented by 8 or more genomes are shown. We show the age of the last common ancestors of major taxa (phyla, class, order and family) represented in our 1007 genomes dataset by at least 3 genomes. The median ages are: phyla: 2115 Ma; class: 1524 Ma; order: 11120 Ma; family: 655 Ma. Black dots denote nodes that were directly calibrated in molecular clock analyses. — biorxiv.org
https://www.biorxiv.org/content/10.1101/2023.08.08.552427v1
Astrobiology