A Rocky Exoplanet Classification Method And Its Application To Calculating Surface Pressure And Surface Temperature
With over 5,000 exoplanets currently detected, there is a need for a primary classification method to prioritise candidates for biosignature observations.
Here, we develop a classification method to categorise rocky exoplanets based on their closest solar system analogue using available data of observed stellar and planetary features, masses, and radii, to model non-thermal atmospheric escape, thermal atmospheric escape, and stellar irradiation boundaries.
Applying this classification method to the 720 rocky exoplanets in our sample with uncertainties in planetary masses, radii, stellar temperatures, and fluxes propagated via a Monte Carlo model indicates that 22% ± 8% are Mercury analogues, 39% ± 4% are Mars analogues, 11% ± 1% are Venus analogues, 2% ± 1% are Earth analogues, and 26% ± 12% are without a known planetary counterpart in our solar system.
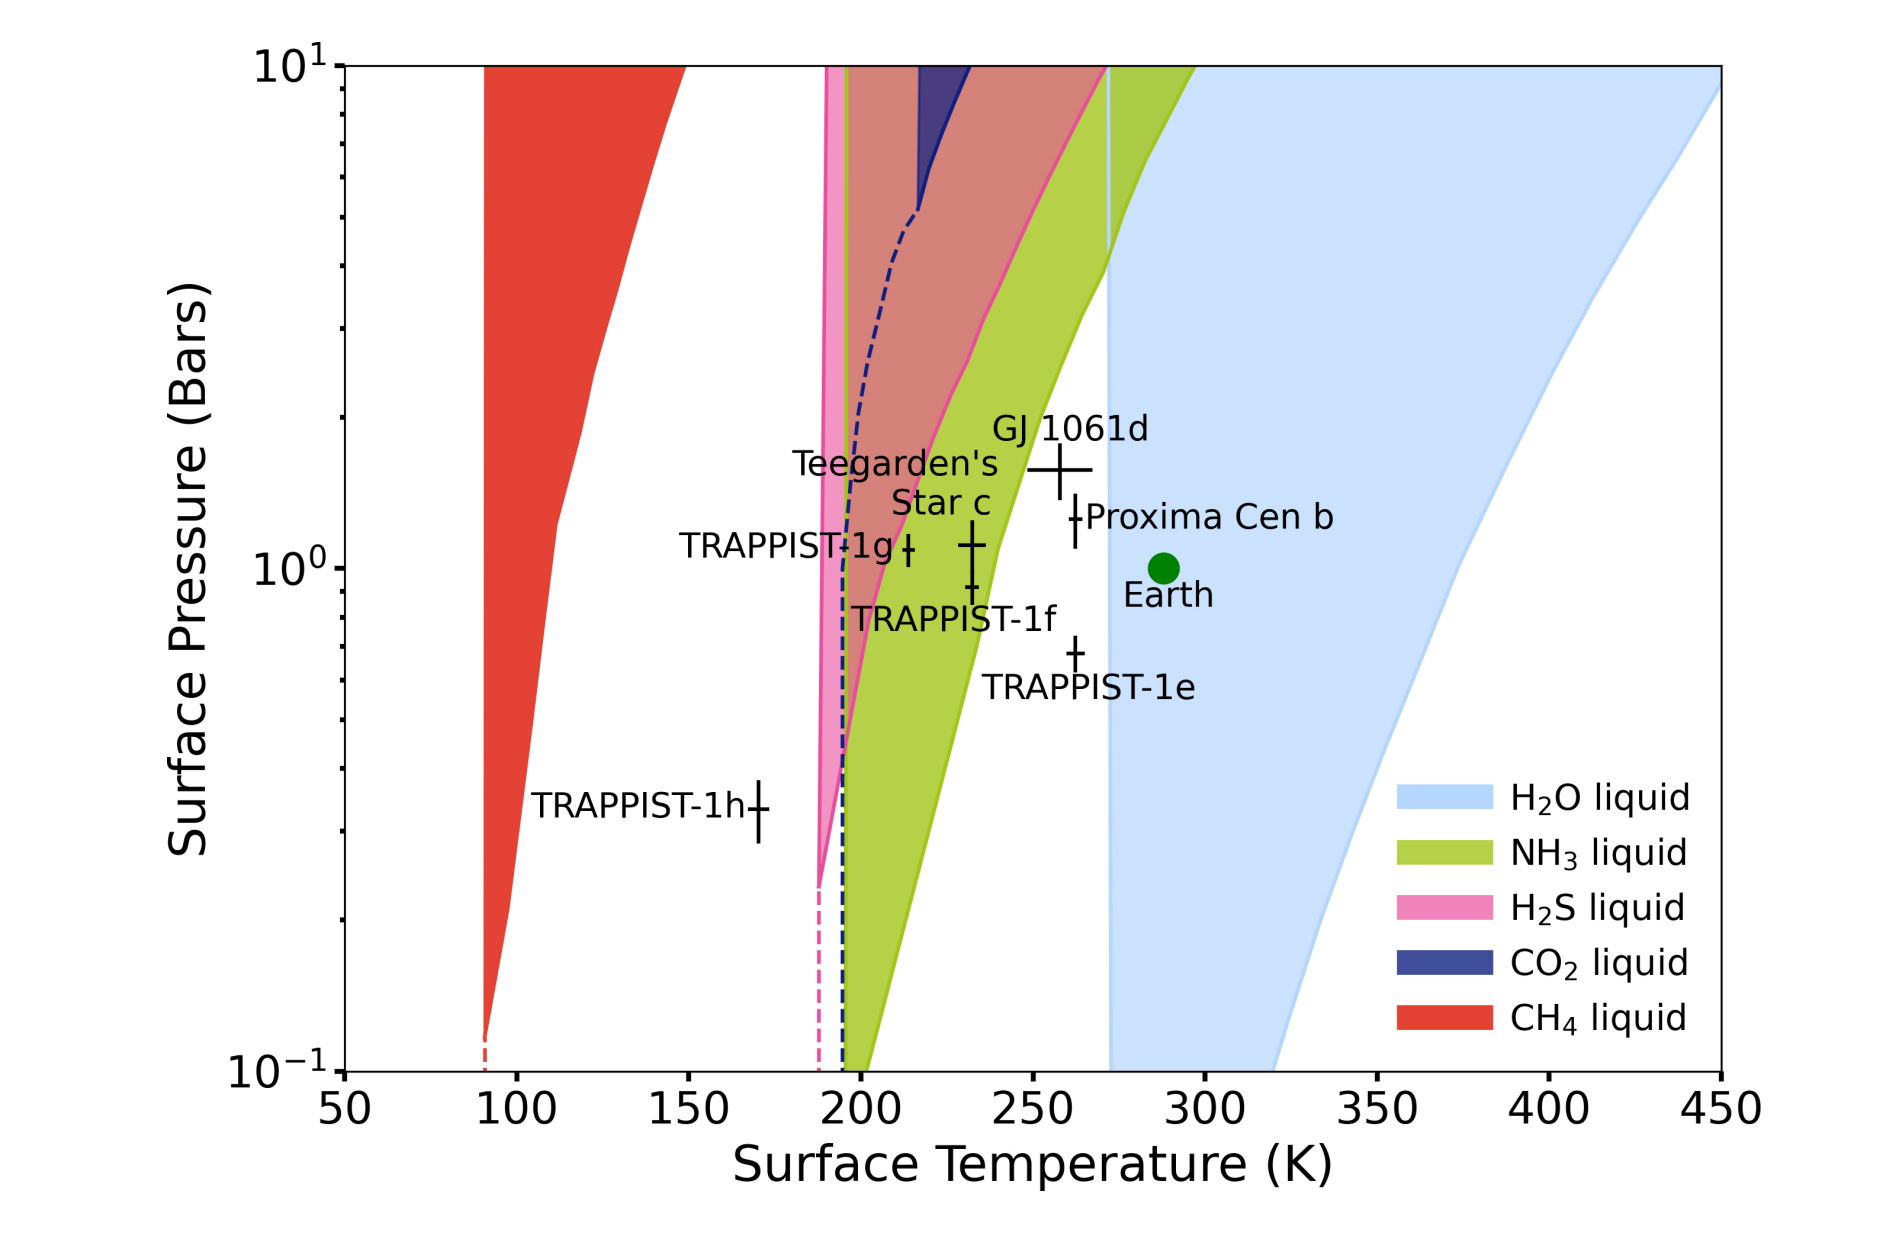
Extrapolating to conditions on LHS 3844b and GJ 1252b, our classification method gives results reasonably consistent with current observations. Subsequently, to demonstrate the functionality of this classification method, we plot our catalogued sample of exoplanets on an adjusted surface pressure versus temperature phase diagram, presenting more realistic estimates of the potential surface phases (gas, liquid or ice).
Our new classification method could help target selection for future exoplanet characterisation missions.
Sarah R.N. McIntyre, Penelope L. King, Franklin P. Mills
Comments: Accepted for publication in MNRAS, 13 pages, 7 figures
Subjects: Earth and Planetary Astrophysics (astro-ph.EP); Instrumentation and Methods for Astrophysics (astro-ph.IM)
Cite as: arXiv:2301.03348 [astro-ph.EP] (or arXiv:2301.03348v1 [astro-ph.EP] for this version)
Submission history
From: Sarah McIntyre
[v1] Mon, 9 Jan 2023 14:04:06 UTC (6,358 KB)
https://arxiv.org/abs/2301.03348
Astrobiology,