Exocomets Size Distribution In The β Pictoris Planetary System

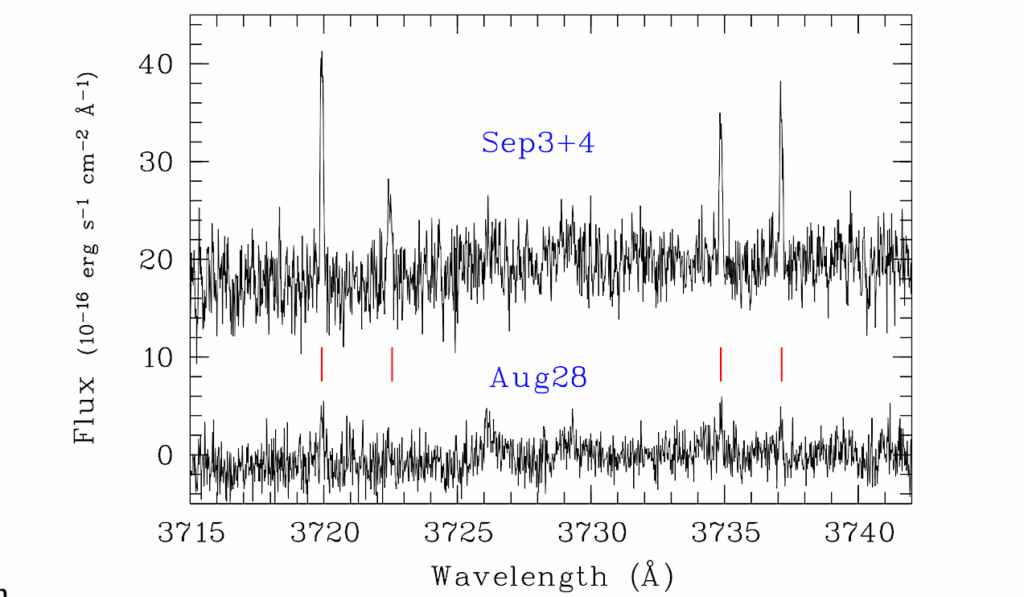
The star β Pictoris harbors a young planetary system, which is characterized by the presence of a gaseous and dusty debris disk, at least two massive planets and many minor bodies. For more than thirty years, exocomets transiting the star have been detected using spectroscopy, probing the gaseous part of the cometary comas and tails.
The detection of the dusty component of the tails can be performed through photometric observations of the transits. Since 2018, the Transiting Exoplanet Survey Satellite has observed β Pic for a total of 156 days. Here we report an analysis of the TESS photometric data set with the identification of a total of 30 transits of exocomets.
Our statistical analysis shows that the number of transiting exocomet events (N) as a function of the absorption depth (AD) in the light curve follows a power law in the form dN(AD)∝AD−α, where α=2.3±0.4. This distribution of absorption depth leads to a differential comet size distribution proportional to R−γ, where γ=3.6±0.8, showing a striking similarity to the size distribution of comets in the Solar system and the distribution of a collisionally relaxed population (γD=3.5).
A. Lecavelier des Etangs, L. Cros, G. Hébrard, E. Martioli, M. Duquesnoy, M. A. Kenworthy, F. Kiefer, S. Lacour, A.-M. Lagrange, N. Meunier, A. Vidal-Madjar
Comments: This is a preprint version of an article published in Scientific Reports. The final version is available online at this https URL
Subjects: Earth and Planetary Astrophysics (astro-ph.EP)
Cite as: arXiv:2204.13618 [astro-ph.EP] (or arXiv:2204.13618v1 [astro-ph.EP] for this version)
Journal reference: Scientific Reports 12, 5855 (2022)
Related DOI:
https://doi.org/10.1038/s41598-022-09021-2
Focus to learn more
Submission history
From: Alain Lecavelier des Etangs
[v1] Thu, 28 Apr 2022 16:31:28 UTC (1,276 KB)
https://arxiv.org/abs/2204.13618
Astrobiology,